| OCR Text |
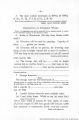
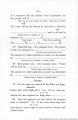
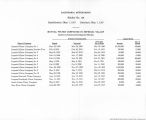
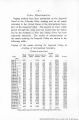
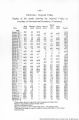
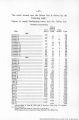
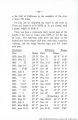
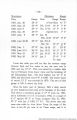
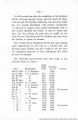
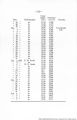
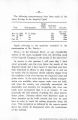
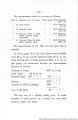
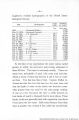
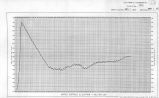
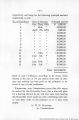
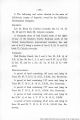
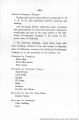
Show -32- Maximum. Minimum. Range. Date. Gauge. Date. Gauge. Range. 1895, Jan. 20 28' 2" (From Gila) 11' 5" 1895, May 23 23' 9" Feb. 12-14 16' 9" 7' 0" 1896, June 9 24' 1" Dec. 17-18 17' 5" 6' 8" 1896, Sep. 30 24' 6" (Quick rise) 7' 1" 1897, June 9 26' 1" Jan. 12 Feb. 12-17 17'11" 8' 2" 1898, June 26-29 23' 6" Jan. 8-9 & Dec. 30 17' 6" 6' 0" 1899, July 1 27' 0" Oct. 16-18 17' icr 0" 1900, June 9-11 26' 0" Sep. 10-11 16' 5" 9' 7" 1901, May 31 27' 2" Jan. 14-15 16' 2" 11' 0" 1902, May 26 24' 6" Jan. 3 17' 0" 7' 6" To date. From this table you will see that the extreme range between high and low water in any one year was in 1891 and was 16' 9". This was caused by a sudden high rise in February from heavy rains and the breaking of the Hassayampa dam. The next highest was 14' 4" in 1884, and the lowest was 6' 0" in 1898. The lowest waste of record, 13' 2" was recorded in 1879. The zero of this gauge is 100 ft above sea level. Since the latter part of January, 1901 a daily record of river height has been kept at the headgate of the canal. This shows a maximum gauge of 17' 6" June 1st, 1901, and a minimum of 11 ft. in January, 1902, or a range of 6' 6" against 10' 2" at Yuma (compare May 31, 1901, 27' 2" with Jan. 3, 1902, 17' 0"). This shows that only some nine miles by river below Yuma the range of the river is but 60 per cent of its Yuma range, and it is |
| Source |
Original book: [State of Arizona, complainant v. State of California, Palo Verde Irrigation District, Coachella Valley County Water District, Metropolitan Water District of Southern California, City of Los Angeles, California, City of San Diego, California, and County of San Diego, California, defendants, United States of America, State of Nevada, State of New Mexico, State of Utah, interveners] : California exhibits. |