| OCR Text |
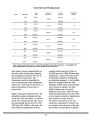
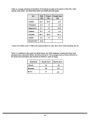
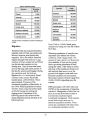
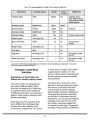
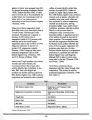
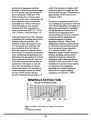
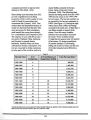
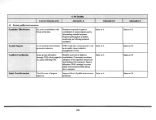
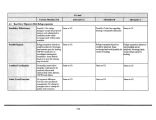
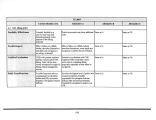
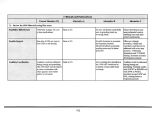
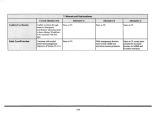
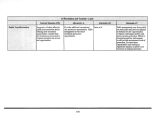
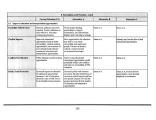
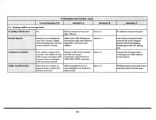
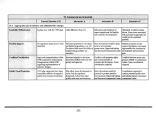
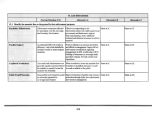
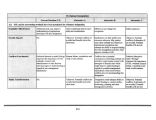
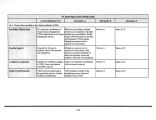
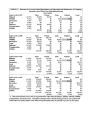
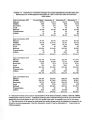
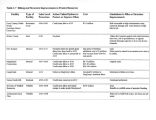
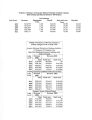
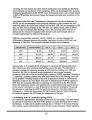
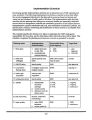
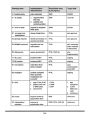
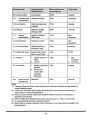
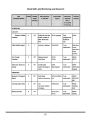
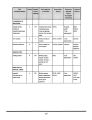
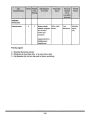
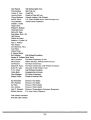
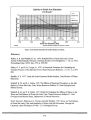
Show Table 1- 5 Comparison of Capital Damages Among Management Alternatives over Hypothetical Eleven- Current Management Mineral * 1 Wildlife * 2 Recreation * 3 Local Railroad " 4 Transportation Utilities Total Year Period * 1,2 ( 000) Dollars Private State Federal Local $ 2,445,022 $ 103,196 $ 49,000 $ 0 $ 4,746,825 $ 0 $ 0 $ 7,344,043 $ 2,373,347 $ 0 $ 0 $ 0 $ 4,653,750 $ 0 $ 0 $ 7,027,097 95.68% $ 47,467 $ 0 $ 0 $ 0 $ 46,538 $ 0 $ 0 $ 94,004 1.28% $ 0 $ 14,696 $ 0 $ 0 $ 0 $ 0 $ 0 $ 14,696 0.20% $ 24,208 $ 88,500 $ 49,000 $ 0 $ 46,538 $ 0 $ 0 $ 208,246 2.84% Alternative A Mineral * 1 Wildlife * 2 Recreation * 3 Local Railroad * 4 Transportation Utilities Total Private State Federal Local $ 2,454,817 $ 104,096 $ 49,000 $ 0 $ 4,816,631 $ 0 $ 0 $ 7,424,545 $ 2,382,855 $ 0 $ 0 $ 0 $ 4,722,188 $ 0 $ 0 $ 7,105,043 95.70% $ 47,657 $ 0 $ 0 $ 0 $ 47,222 $ 0 $ 0 $ 94,879 1.28% $ 0 $ 14,696 $ 0 $ 0 $ 0 $ 0 $ 0 $ 14,696 0.20% $ 24,305 $ 89,400 $ 49,000 $ 0 $ 47,222 $ 0 $ 0 $ 209,927 2.83% Alternative B Mineral * 1 Wildlife * 2 Recreation * 3 Local Railroad * 4 Transportation Utilities Total Private State Federal Local $ 1,743,121 $ 87,694 $ 14,000 $ 0 $ 4,258,181 $ 0 $ 0 $ 6,102,996 $ 1,692,022 $ 0 $ 0 $ 0 $ 4,174,688 $ 0 $ 0 $ 5,866,709 96.13% $ 33,840 $ 0 $ 0 $ 0 $ 41,747 $ 0 $ 0 $ 75,587 1.24% $ 0 $ 5,344 $ 0 $ 0 $ 0 $ 0 $ 0 $ 5,344 0.09% $ 17,259 $ 82,350 $ 14,000 $ 0 $ 41,747 $ 0 $ 0 $ 155,355 2.55% Alternative C Mineral * 1 Wildlife * 2 Recreation * 3 Local Railroad * 4 Transportation Utilities Total Private State Federal Local $ 2,474,408 $ 104,696 $ 49,000 $ 0 $ 4,816,631 $ 0 $ 0 $ 7,444,735 $ 2,401,871 $ 0 $ 0 $ 0 $ 4,722,188 $ 0 $ 0 $ 7,124,059 95.69% $ 48,037 $ 0 $ 0 $ 0 $ 47,222 $ 0 $ 0 $ 95,259 1.28% $ 0 $ 14,696 $ 0 $ 0 $ 0 $ 0 $ 0 $ 14,696 0.20% $ 24,499 $ 90,000 $ 49,000 $ 0 $ 47,222 $ 0 $ 0 $ 210,721 2.83% * 1 Mineral revenues are calculated over the eleven year period with salinity assumed to be similar to the present conditions- causeway with culverts closed. State revenues ( taxes and royalties) are estimated at 2% of mineral revenues. Local revenues ( property taxes) are estimated at 1% of mineral revenues. * 2 Wildlife revenues are estimated from data on waterfowl hunting in " The Economics of the Great Salt Lake" ( draft), Alan E. Isaacson, BEBR, prepared for an upcoming book on Great Salt Lake, edited by Wally Gwynn. These expenitures on equipment and travel are assumed to benefit local economies. * 3 Recreation revenues are based on visitor day use at Antelope Island as reported by the Utah Division of Parks and Recreation. Expenditures are assumed to be $ 20/ visitor day. Visitor days are based on average visitation in 1998. Visitation is suspended at 4208 when causeway is assumed closed or flooded. As with revenues from waterfowl hunting, these reven ues benefit local economies. * 4 Railroad revenues are based on an estimate of 40 trains per day which use the north and south railroad causeways. Each train is assumed to be 25 cars, 100 tons, at a rate of $ 15.00/ ton. Rail trips are reduced or rerouted out of state as the lake reaches elevations of 4208 and above. State and local revenues ( taxes) are estimated at 1% each of rail revenues. |