| Title |
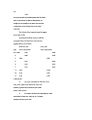
No. 15, Original. In the Supreme Court of the United States. October Term, 1929. The United States of America, Plaintiff, v. The State of Utah, Defendant. Digest of Testimony taken before Charles Warren, Special Master. APPENDIX to Brief for the United States |
| Creator |
United States. Supreme Court; Warren, Charles |
| Subject |
Mines and mineral resources -- Environmental aspects -- Utah; United States -- Trials, litigation, etc.; Utah -- Trials, litigation, etc.; Utah -- Trials, litigation, etc.; Utah -- Trials, litigation, etc.; Colorado River (Colo.-Mexico); Colorado River (Colo.-Mexico) -- Environmental aspects |
| Description |
Transcripts of the Colorado Riverbed Case |
| Publisher |
Digitized by J. Willard Marriott Library, University of Utah |
| Date |
1929 |
| Type |
Text |
| Format |
application/pdf |
| Format Creation |
Scans of microfilm taken from the originals were used to transcribe the text, pdf's generated from transcriptions. |
| Identifier |
Reel1-Vol0.1-0.2.pdf |
| Language |
eng |
| Relation |
is part of Colorado Riverbed Case |
| Spatial Coverage |
Colorado; Utah; Mexico |
| Rights Management |
Digital image Copyright 2009, University of Utah. All Rights Reserved. |
| Bit Depth |
8 bit grayscale |
| ARK |
ark:/87278/s6rj4m4m |
| Setname |
usa_crc |
| ID |
119204 |
| Reference URL |
https://collections.lib.utah.edu/ark:/87278/s6rj4m4m |