| OCR Text |
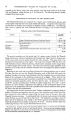
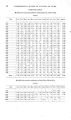
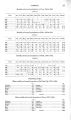
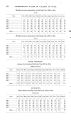
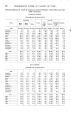
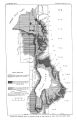
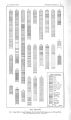
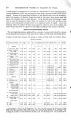
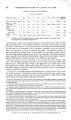
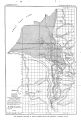
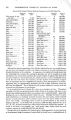
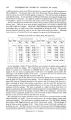
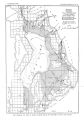
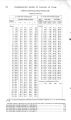
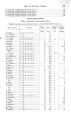
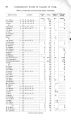
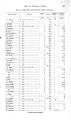
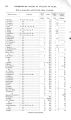
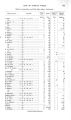
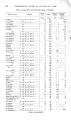
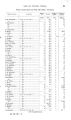
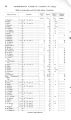
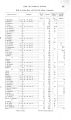
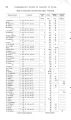
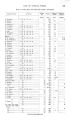
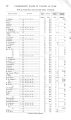
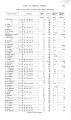
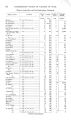
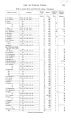
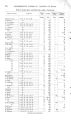
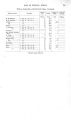
Show H Y D R O G R A P H Y . ] 9 m e n t s w e r e m a d e a t t h e m o u t h s of t h e c a n y o n s . Below t h e s e p o i n t s , d u r i n g t h e i r r i g a t i on s e a s o n , t h e w a t e r is d i v e r t e d a n d c o n d u c t e d over t h e v a l l e y i n an i n t r i c a t e s y s t e m of d i t c h e s , so t h a t t h e s t r e a m b e d s i n t h e i r lower s t r e t c h e s a r e t h e n o f t e n d r y . D u r i n g t he flood s e a s o n t h e s t r e a m s d i s c h a r g e d i r e c t l y i n t o e i t h e r U t a h L a k e or J o r d a n R i v e r . Foll o w i n g a r e t a b l e s of m o n t h l y m e a s u r e m e n t s for 1904, t o w h i c h a n n u a l s u m m a r i e s for s e v e r al y e a r s a r e a d d e d w h e r e figures a r e a v a i l a b l e: Estimated discharge { at mouths of canyons) of streams tributary to Jordan River and Utah Lake. CITY CREEK. [ Drainage area, 19 square miles.] Discharge. Maximum. Minimum. Mean. Total. Run- off. Per square mile. Depth. Relation t o rainfall. 1904. J a n u a ry F e b r u a ry March April June J u ly August September. October November. December.. Year. 1903. 1902. 1901. 1900. 1899. Sec. - feet. 6.7 7.9 11.0 28.8 70.1 57.0 26.5 15.3 11.4 9.3 8.7 9.2 Sec- feet. 6.0 6.0 7.3 11.0 28.8 26.6 16.2 11.5 9.4 8.7 8.2 7.7 Sec. - feet. 6.2 6.6 8.1 22.1 55.6 39.2 19.7 13.4 10.4 9.1 8.5 8.0 A cre- feet. 381 380 516 1,315 3,419 2,332 1,211 824 619 609 506 492 Sec- feet. 0.326 .347 .442 1.160 2.926 2.063 1.037 .705 .547 .479 .447 .421 Inches. 0.376 .374 .510 1.294 3.373 2. 301 1.195 .613 .610 .551 .499 .485 Per cent. 20.9 10.3 8.6 66.7 122.2 852.2 202.5 71.9 508.3 46.7 70.1 63.1 58.2 72.0 31.3 121.9 6.0 4.3 3.6 5.0 5.4 3.2 17.2 13.0 12.3 12.7 9.8 20.0 12,604 9,440 8,910 9,251 7,054 14,491 .908 .685 .647 .668 .517 1.053 12. 381 9.323 8.811 9.126 7.040 14.306 EMIGRATION CREEK. [ Drainage area, 19 square miles.] 53.9 61.2 63.1 69.5 53.9 52.5 80.1 1903. J a n u a r y . . . . F e b r u a r y . . March April May June J u ly August September. October November.. December.. Year. 6.3 0.7 .8 .5 11.7 .4 12.8 3.7 19.3 5.5 18.1 4.0 4.0 1.6 1.7 .6 1.1 .6 2.0 1.1 3.2 1.0 .8 .6 19.3 .4 1.1 .6 3.0 8.0 9.5 8.6 2.8 1.0 .8 1.2 1.3 .7 33 184 476 584 512 172 61 48 74 77 43 2,332 0.058 .032 .158 .421 .500 .453 .147 .053 .042 .063 .068 .037 .169 0.069 .033 .182 .470 .576 .505 .169 .061 .047 .073 .076 .043 2.304 2.3 3.1 9.2 45.6 17.9 136.5 120.7 14.2 5.3 13.3 5.5 5.9 15.6 a The record of rainfall given under City, Emigration, Parleys, and Mill creeks is t h e m e a n precipitat i o n for Salt Lake City and P a r k City; t h a t under American Fork and Provo River is for Provo and Heber; t h a t under Spanish F o r k is for Provo, Thistle and Soldiers Summit. |