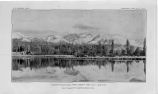
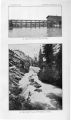
| OCR Text |
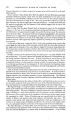
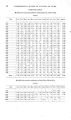
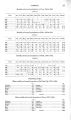
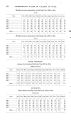
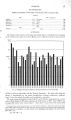
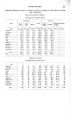
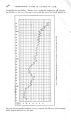
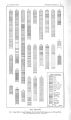
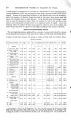
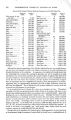
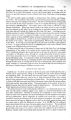
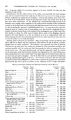
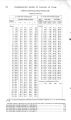
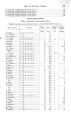
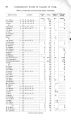
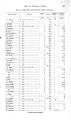
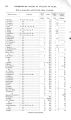
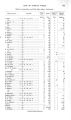
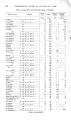
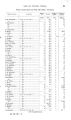
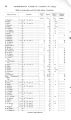
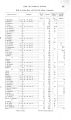
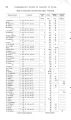
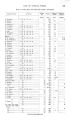
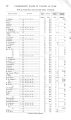
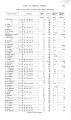
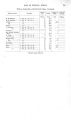
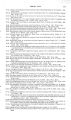
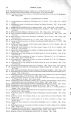
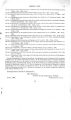
Show 16 UNDERGROUND WATER IN VALLEYS OF UTAH. Monthly maximum temperature at Salt Lake City, 1899 to 190J/,. [° F.] Year. J a n . Feb. Mar. Apr. May. June. July. Aug. Sept. Oct. Nov. Dec. 1899.* 54 57 51 43 53 48 51 55 55 62 42 66 67 72 65 58 65 63 80 78 79 78 80 78 CO OS OQ OO CD CO 00 00 00 00 00 00 96 101 90 98 91 92 97 99 101 96 96 97 91 94 95 98 98 94 91 88 86 92 92 92 73 76 85 81 77 83 63 68 67 70 70 66 1900 1901 59 1902 ." 58 1903 45 1904 55 Mean 51 55 65 79 86 95 98 95 90 79 67 55 Monthly minimum temperature at Salt Lake City, 1899 to 190^. [° F.] Year. J a n . Feb. Mar. Apr. May. June! July. Aug. Sept. Oct. Nov. Dec. 1899 16 - 1 0 20 30 25 34 51 46 46 30 28 9 1900 20 4 10 15 26 25 30 15 40 43 47 40 53 49 52 56 32 39 27 36 28 29 2 1 9 0 1 . . . ; . . . . 11 1902 - 4 12 21 32 35 42 43 52 35 36 21 15 1903 15 - 4 14 25 33 54 46 48 37 32 17 14 1904 7 8 19 30 36 44 51 46 38 28 26 7 Mean 11 10 21 27 35 44 49 50 38 32 25 10 WIND VELOCITY. Average wind velocity at Salt Lake City, 1900 to 1904-. [ Miles per hour.] Year. J a n . Feb. Mar. Apr. May. June. July. Aug. Sept. Oct. Nov. Dec. Annual. 1900 3.4 5.0 3.8 4.8 4.1 5.2 4.0 5.5 4.5 6.3 6.3 6.2 6.9 6.8 7.3 7.3 7.8 6.7 7.3 7.2 6.8 7.3 7.1 6.1 6.8 6.5 6.6 6.7 6.6 6.5 6.0 6.3 6.7 7.2 6.5 6.4 5.8 6.5 6.2 5.7 6.5 7.0 6.7 6.3 6.0 6.5 5.0 5.7 5.3 5.4 5.0 4.9 6.0 5.4 4.7 4.5 4.8 4.7 3.7 4.9 5.9 1901 1902 1903 1904 5.9 6.1 5.8 6.0 Mean 4.2 5.1 6.7 7.2 6.8 7.0 6.5 6.1 6.5 5.6 5.2 4.5 5.9 HUMIDITY. Mean relative humidity at Salt Lake City, 1900 t » 190J+. [ Per cent.] Year. J a n . Feb. Mar. Apr. May. June. July. Aug. Sept. Oct. Nov. Dec. Annual. 1900 : 78 69 83 73 75 65 73 62 74 62 40 55 58 52 64 59 42 48 44 46 41 44 43 48 49 25 36 31 38 38 24 26 27 30 33 24 39 27 28 38 36 30 32 38 34 48 50 40 45 53 62 57 56 64 45 63 71 65 75 60 47 1901 49 1902 48 1903 51 1904 58 Mean 76 67 54 18 45 34 28 31 34 47 57 67 49 |