| OCR Text |
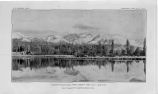
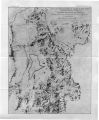
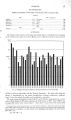
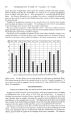
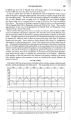
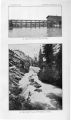
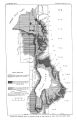
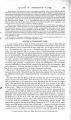
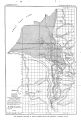
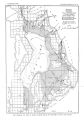
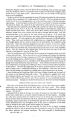
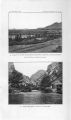
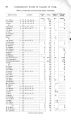
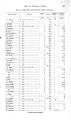
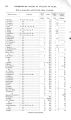
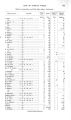
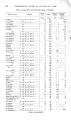
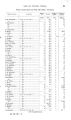
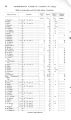
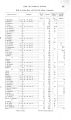
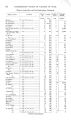
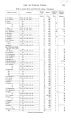
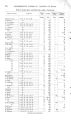
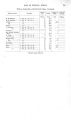
Show 4 CONTENTS AND ILLUSTRATIONS. Underground water- Continued. Page. Well data. 56 Method of measurement 56 List of typical wells. 59 Index 77 ILLUSTRATIONS. PLATE I. Wasatch Mountains from Liberty Park, Salt Lake City 5 II. Map of the valleys of Utah Lake and Jordan River, showing drainage area r 6 III. A, Northern end of Utah Lake; B, Head- gate of Jordan and Salt Lake City canal 12 IV. A, Gate at head of Jordan River; B, Dead Man's Falls, Cottonwood Canyon 24 V. Well sections * ... 28 VI. Sketch map showing depth to ground water in the valleys of Utah Lake and Jordan River 30 VII. Map showing the area in which flowing wells are obtained in Jordan River Valley 38 VIII. Map showing the area in which flowing wells are obtained in Utah Lake Valley 48 IX. A, Valley of Provo River below mouth of canyon; B, American Fork at mouth of canyon. - 50 FIG. 1. Diagram showing variation of annual precipitation at Salt Lake City 17 2. Diagram showing mean monthly precipitation at Salt Lake City 18 3. Diagram showing fluctuation of the surface of Utah Lake, 1889- 1904 .. 23 4. Diagram showing fluctuation of the surface of Great Salt Lake, 1873- 1903 26 5. Diagram illustrating flow from vertical and horizontal pipes 57 |