| OCR Text |
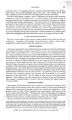
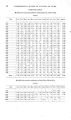
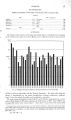
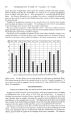
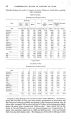
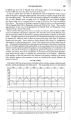
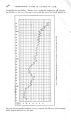
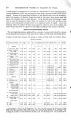
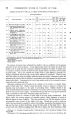
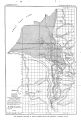
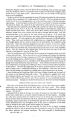
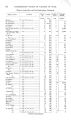
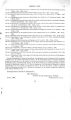
Show CLIMATE. 17 EVAPORATION. Depth of evaporation at Utah Lake afrork August, 1903, to August, 1904. [ Inches.] 1903. August 8. 40 September 6. 78 October 3. 86 November 2. 50 December 1. 50 1904. January 1.50 1904- Continued. February 2.00 March 3. 50 April 4.63 May*. 7. 72 June 8.80 July 9. 41 Total ; 60. 60 SUMMARY. The climate of t h e valleys of Utah Lake and Jordan River is controlled by their location in the central eastern part of t h e Great Basin, but is modified somewhat by t h e proximity so • , A5 10 5 - K K K C O C O < 0 < t > ^ « 3 - ^ Q 3 © ^ g 5 - O i § g l CaT j C r i C T i a ^ C ^ C r j O) 5 J ) ^ ) ^ ^ J ) J ) 0 ) ^ 0 > 0 ) . FIG. 1.- Diagram showing variation of annual precipitation at Salt Lake City. of Utah and Great Salt Lakes and t h e Wasatch Mountains. The tables show that the climato is characterized by low annual precipitation, moderate temperature, moderate wind velocity, low relative humidity, and considerable evaporation. The mean annual precipitation at Salt Lake City is 16.19 inches, ranging between a maximum of 23.64 inches in 1875 and a minimum of 10.33 inches in 1890. Since 1900 it has averaged 2.2 inches below normal ( fig. 1). Only about 18 per cent of t h e annual total a Computed from daily measurements of a tank 3 feet in diameter. Tests were made by the engineer of Salt Lake City from 1901 to 1903, and since then they have been kept up by the Reclamation Service under G. L. Swendsen. See also Newell, F. H., Fourteenth Ann. Kept. U. S. Geol. Survey, pt. 2,1894, p. 154. IKE 157- 06 2 |