| OCR Text |
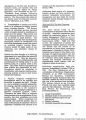
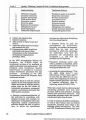
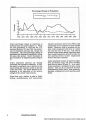
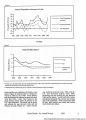
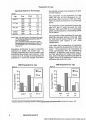
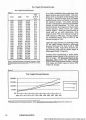
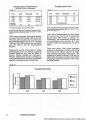
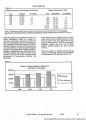
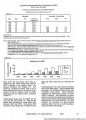
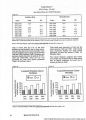
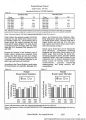
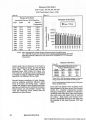
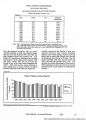
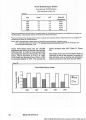
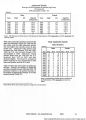
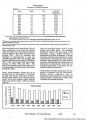
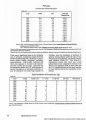
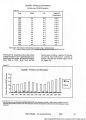
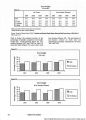
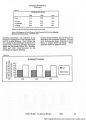
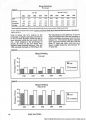
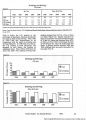
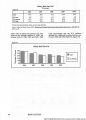
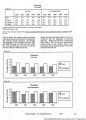
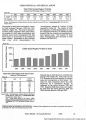
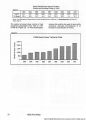
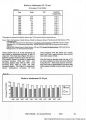
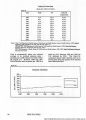
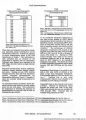
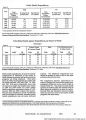
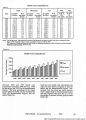
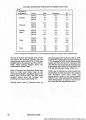
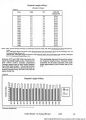
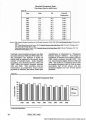
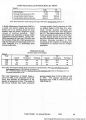
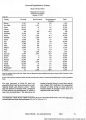
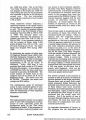
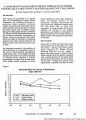
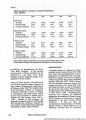
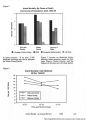
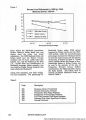
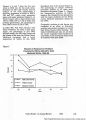
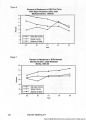
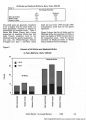
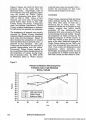
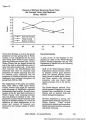
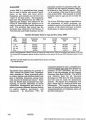
Show Table 26 Atherosclerosis Age-adjusted Rates per 100,000 Population Year Utah1 US Utah:US Comparison 1979 - 5.7 - 1980 4.0 5.7 0.70:1 1981 - 5.2 - 1982 - 4.8 - 1983 3.0 4.6 0.65:1 1984 - 4.2 - 1985 - 4.0 - 1986 2.6 3.7 0.70:1 1987 - 3.6 - 1988 - 3.4 - 1989 2.5 2.9 0.86:1 1990 - 2.7 - Atherosclerosis (ICD-9 Code: 440) (1990 Total Deaths in Utah = 77) Figure 21 Atherosclerosis E3 Utah ? US 6-r i. I -s i 4 S = 3 I I § 1 1l I I i 1980 1983 1986 1989 Source: Utah - Utah Department of Health, Bureau of Vital Records and Health Sutistics. Unpublished report. UJS. -1980-1990: National Center for Health Statistics. Monthly Vital Statistics Report. 21(6); 24(6); 25(6); 2£(5); 22(6); 22(7); 42(8); 41(7). Public Health Service. Washington, D.C.: U.S. Government Printing Office. Atherosclerosis Table 27 Utah's age-adjusted death rates for atherosclerosis are lower than the nation's (Table 26, Figure 21). Death rates for both Utah and the nation declined from 1979 to 1990. Utah's death rates for atherosclerosis did not appear to drop as much between 1986 and 1989 as did the nation's (Figure 21). Throughout the 1980's, Utah's death rate was a little over two-thirds of the nation's, but became more similar in 1989 (0.86:1). Utah Age-adjusted Mortality by Sex^ Rates per 100,000 Population Years Total Male Female 1979-81 4.0 4.4 3.7 1982-84 3.0 2.6 32 1985-87 2.6 2.8 23 1988-90 2.5 2.9 2.2 Source: Utah Department of Health, Bureau of Vital Records and Health Statistics. Unpublished report Utah male and female death rates from atherosclerosis improved from 1979 to 1990 (Table 27). Male death rates in Utah resemble the national average between 1988 and 1990. Female death rates are generally lower than males, with the exception of the period from 1982 to 1984. ^From 1979 to 1990 the Utah numbers represent a three-year average because of the small number of deaths per year. 24 HEALTH STATUS |