| OCR Text |
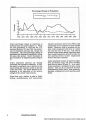
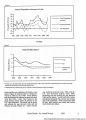
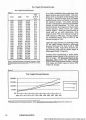
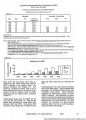
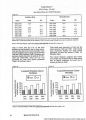
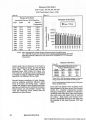
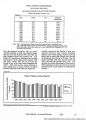
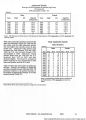
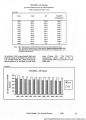
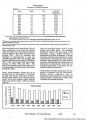
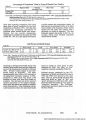
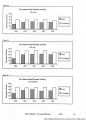
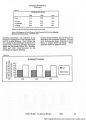
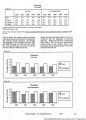
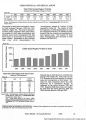
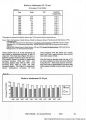
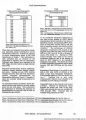
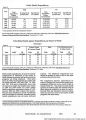
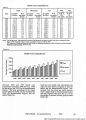
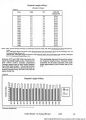
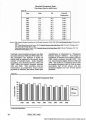
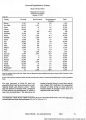
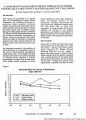
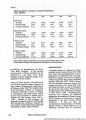
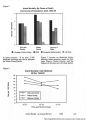
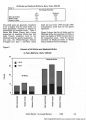
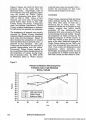
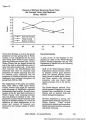
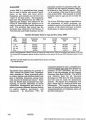
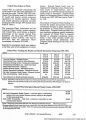
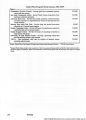
Show Table 67 Births to Adolescents (15 -19 yrs) (Percentage of Total Births) Year Utah1 US1 UtahrUS Comparison 1980 10.9 15.3 0.71:1 1981 10.6 14.5 0.73:1 1982 10.1 14.0 0.72:1 1983 9.2 13.4 0.69:1 1984 8.6 12.8 0.67:1 1985 8.8 12.4 0.71:1 1986 9.3 12.3 0.76:1 1987 9.4 12.1 0.78:1 1988 9.2 12.2 0.75:1 1989 9.8 12.5 0.78:1 1990 10.1 12.5 0.81:1 * Percentages were obtained by dividing live births for ages IS-19 by total live births for each specific year. Source: Utah • Utah Department of Health, Division of Health Care Resources, Bureau of Vital Records and Health Statistics. (1992). Unpublished report U.S. 1980-1988: National Center for Health Statistics. Vital Statistics of the United States. (1980-1988). Volume I, Natality. Washington, D.C.: U.S. Government Printing Office. Separate documents for each year, see reference section for specific references. 1989 and 1990: National Center for Health Statistics. (1989 and 1990). Monthly Vital Statistics Report. Public Health Service, Washington, D.C.: U.S. Government Printing Office. Utah is below the U.S. in the percentage of total births to adolescents between 15 and 19 years old. The trend lines (Figure 56) show a different pattern between Utah and the U.S. The nation's figures for births to adolescents declined between 1980 and 1987, but increased slightly from 1988 to 1990. Utah declined from 1980 to 1984, but then increased slightly. The Utah:U.S. comparison shows substantial variation in how Utah compares with the nation on a yearly basis, but Utah is approximately three-fourths that of the nation overall. Data for births to females under the age of 15 are also available but have not been included in this Review. These data indicate, however, that Utah's rate is approximately one-third that of the nation in births to those under the age of 15. Figure 56 16 t « 12 + I i I Births to Adolescents (15-19 yrs) i i i i i I i 1980 1981 1982 1983 1984 1985 1986 1987 1988 1989 1990 ESUtah ? us Utah's Health: An Annual Review 1993 55 |