| OCR Text |
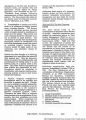
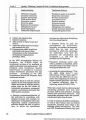
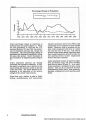
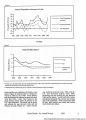
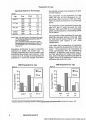
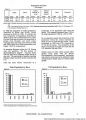
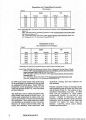
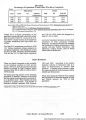
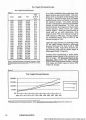
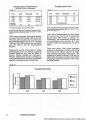
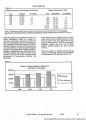
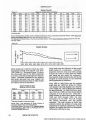
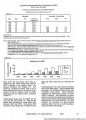
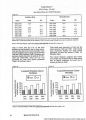
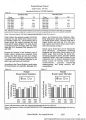
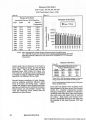
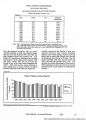
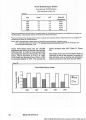
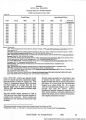
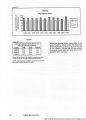
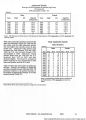
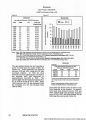
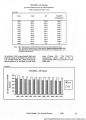
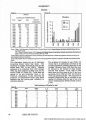
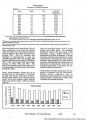
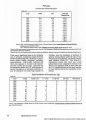
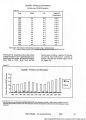
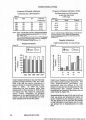
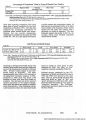
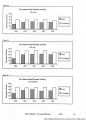
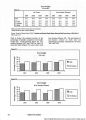
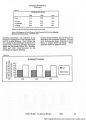
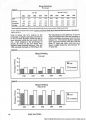
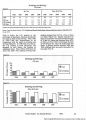
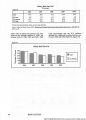
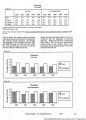
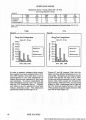
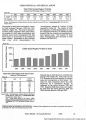
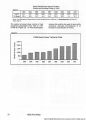
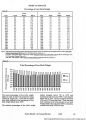
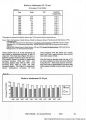
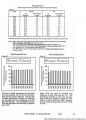
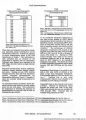
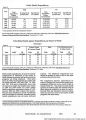
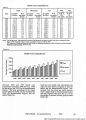
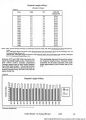
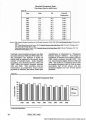
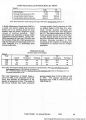
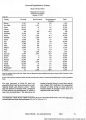
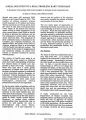
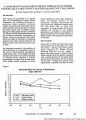
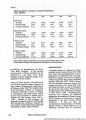
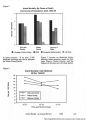
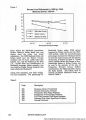
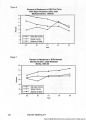
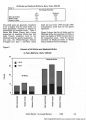
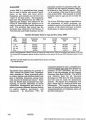
Show Population by Age Age Distribution by Percentage Table 2 Age Year Utah US under 5 1980 1990 13.0 9.8 7.2 7.5 5-17 yrs 1980 1990 24.0 26.6 21.0 18.2 65+yrs 1980 1990 7.5 8.7 11.3 12.5 median age (yr.) 1980 1990 24 26 30 33 Source: Utah - Utah State Economic Coordinating Committee. (1992). Economic Report to the Governor 1992. Salt Lake City: Author, p. 120. U.S. • United States Bureau of the Census. (1992). Statistical Abstract of the United States: 1992 (112th ed.). Washington, D.C.: U.S. Government Printing Office, p. 19. Population distribution by age is especially important to health and health care. A younger population has a lower mortality rate and utilizes fewer health care resources. Utah is above the U.S. average in the proportion of population 17 years and younger, and below the national average in its proportion of those over 65 (Table 2). The proportion of the population in Utah under the age of five decreased by 3.2 percentage points between 1980 and 1990, while the nation increased by 0.3 percentage points. The proportion of the population between the ages of 5 and 17 years increased for Utah between 1980 and 1990 by 2.6 percentage points, and decreased by 2.8 percentage points for the nation. The proportion of the population 65 years and older has increased between 1980 and 1990 for Utah and the nation (Figure 4 for 1980 comparisons and Figure 5 for 1990 comparisons). Utah ranks first in proportion of population below 18, and 49th in population 65 years and older.1 This underscores the importance of using age-adjusted data for comparative purposes. In addition, most hospital stays of an older population are longer and costlier; thus, states with older populations are likely to appear worse off in measures of health care utilization and health care costs. Figure 4 1980 Population by Age Figure 5 1990 Population by Age Utah State Economic Coordinating Committee. (1992). Economic Report to the Governor 1992. Salt Lake City: Author, p. 130. DEMOGRAPHICS |