| OCR Text |
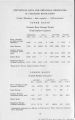
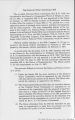
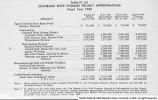
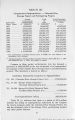
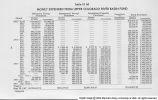
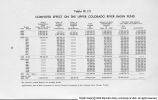
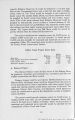
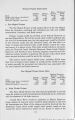
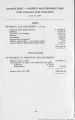
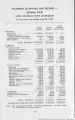
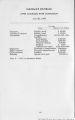
Show Table IX (d) MONEY EXPENDED FROM UPPER COLORADO RIVER BASIN FUND Deficiency Energy Impairment Energy Impairment Capacity _ Purchases Purchases Purchases Expenditures Total Purchases Month Monthly Monthly Monthly Extraordinary Monthly Purchase Accumulated Purchase Accumulated Purchase Accumulated Maintenance Purchase Accumulated 1963-April $10,982.43 $10,982.43 $10,982.43 $10,982.43 May 23,217.42 34,199.85 23,217.42 34,199.85 June 55,419.75 89,619.60 55,419.75 89,619.60 July 23,036.85 112,656.45 23,036.85 112,656.45 Aug. 112,656.45 112,656.45 Sept. 190,213.80 302,870.25 190,213.80 302,870.25 Oct. 238,698.08 541,568.33 238,698.08 541,568.33 Nov. 306,937.18 848,505.51 306,937.18 848,505.51 Dec. 181,810.48 1,030,315.99 181,810.48 1,030,315.99 1964-Jan. 130,080.79 1,160,396.78 130,080.79 1,160,396.78 Feb. 116,391.41 1,276,788.19 116,391.41 1,276,788.19 Mar. 38,875.72 1,315,663.91 38,875.72 1,315,663.91 Apr. 190,526.67 1,506,190.58 190,526.67 1,506,190.58 May 361,800.33! 1,867,990.91 $ 3,924.28 $ 3,924.28 $ 8,475.70 $ 8,475.70 374,200.311 1,880,390.89 June 126,960.66 1,994,951.57 14,896.15 18,820.43 101,304.63 109,780.33 243,161.44 2,123,552.33 July 102,233.38 2,097,184.95 40,886.72 59,707.15 164,824.63 274,604.96 307,944.73 2,431,497.06 Aug. 307,620.53 2,404,805.48 63,309.62 123,016.77 202,584.63 477,189.59 573,514.78 3,005,011.84 Sept. 217,102.13 2,621,907.61 62,615.35 185,632.12 240,344.63 717,534.22 520,062.11 3,525,073.95 Oct. 151,277.89 2,773,185.50 66,937.84 252,569.96 271,034.63 988,568.85 489,250.36 4,014,324.31 Nov 174,118.44 2,947,303.94 55.301.82 307,871.78 278,304.63 1,266,873.48------ 507,724.89 4,522,049.20 Dec. 247,410.57 3,194,714.51 58,633.18 366,504.96 287,744.63 1,554,618.11 593,788.38 5,115,837.58 1965-Jan. 125,489.21 3,320,203.72 63,188.55 429,693.51 287,744.63 1,842,362.74 476,422.39 5,592,259.97 Feb. 127,810.46 3,448,014.18 57,433.17 487,126.68 271,034.63 2,113,397.37 456,278.26 6,048,538.23 Mar. 3,718.34 3,451,732.52 64,715.45 551,842.13 287,744.63 2,401,142.00 ------ 356,178.42 6,404,716.65 Apr. 210,933.89 3,662,666.41 70,851.21 662,693.34 287,744.63 2,688,886.63 569,529.73 6,974,246.38 May * (- 15,571.89) 3,647,094.52 53,737.95 676,431.29 226,184.63 2,915,071.26 264,350.69 7,238.597.07 June 3,647,094.52 7,947.97 684,379.26 52,805.00 2,967,876.26 ------ 60,752.97 7,299,350.04 (July - Nov.) 3,647,094.52 684,379.26 2,967,876.26 ------ ------ 7,299,350.04 Dec. 35,080.00 3,682,174.52 684,379.26 2,967,876.26 ------ 35,080.00 7,334,430.04 1966-Jan. 108,245.18 3,790,419.70 684,379.26 2,967,876.26 ------ 108,245.18 7,442,675.22 (Feb. - Dec.) 3,790,419.70 684,379.26 2,967,876.26 ------ 7,442,675.22 1967 - (Jan.-Sept. ) 3,790,419.70 684,379.26 2,967,876.26 ------ 7,442,675.22 Total to Sept. 30,1967 $3,790,419.70 $684,379.26 $2,967,876.26 $7,442,675.22 Adjusted |