| OCR Text |
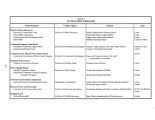
Show Table 11- 2 WATER TREATMENT FACILITIES Water Treatment Plant Owner Current Capacity ( mgd) City Creek Parley's Big Cottonwood Metropolitan Southeast Regional Draper Irrigation Co. Jordan Valley Salt Lake City Salt Lake City Salt Lake City M. W. D. S. L. C. W. C. D. Draper Irrigation Co. C. U. W. C. D.* 15 40 40 113 20 5 180 Total Capacity 413 * Operated by the Salt Lake County Water Conservancy District. Ownership will pass to the SLCWCD ( 5/ 7) and the Metropolitan Water District of Salt Lake City ( 2/ 7). Table 11- 3 CURRENT AND PROJECTED CULINARY WATER DEMAND BY MAJOR WATER SUPPLIER ( acre- feet) Water Supplier 1995 2020 Midvale 4,750 7,030 Magna 7,560 16,390 West Jordan 14,910 28,000 Murray 11,760 18,110 Holladay 3,920 5,150 Herriman 190 540 South Salt Lake City 5,620 9,070 Salt Lake City 100,020 142,990 Kearns 8,340 15,960 SL County WCD ( retail) 12,570 18,190 Granger Hunter WID 26,750 49,800 Bluffdale 560 1,320 Sandy 25,500 42,600 Taylorsville- Bennion 15,640 25,080 Draper 3,320 7,760 Riverton 5,170 12,850 White City 3,840 5,420 South Jordan 5,280 13,040 Total 255,700 419,300 Source: Wasatch Front Water Demand/ Supply Model, Febi nary 1996 11.5 Drinking Water Problems 11.5.1 Future Growth Meeting the water needs of the growing population is probably the largest problem currently facing the culinary water providers. The rate of population increase for Salt Lake County is currently estimated to be 1.92 percent annually. This will yield a population of 1.28 million by the year 2020. It is anticipated that most of this growth will be centered in the south and southwestern portions of the valley; Draper, Riverton, South Jordan, Sandy, Taylorsville, West Jordan and West Valley City. The majority of these areas are serviced primarily by the Salt Lake County Water Conservancy District, and it is 11- 7 |


