| OCR Text |
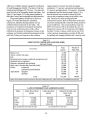
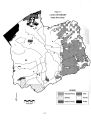
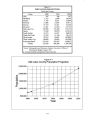
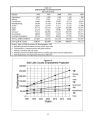
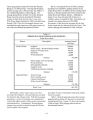
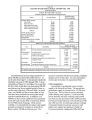
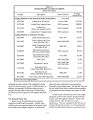
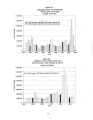
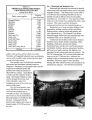
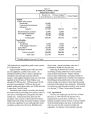
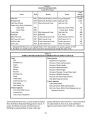
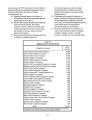
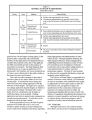
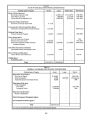
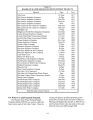
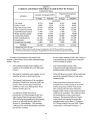
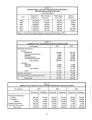
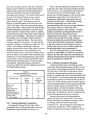
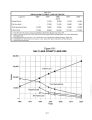
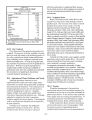
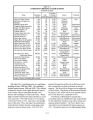
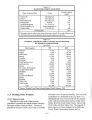
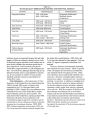
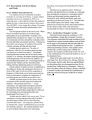
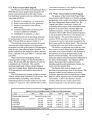
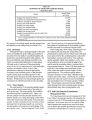
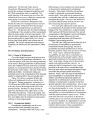
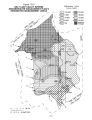
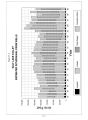
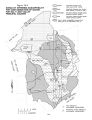
Show taken to insure the 51,200 acres of agricultural land were preserved. Although 43,800 acres of agricultural lands remain in the valley, present land use trends clearly indicate a continuing conversion of agricultural lands, primarily irrigated lands, to urban and commercial developments. Refer to Table 6- 3 for the basin's largest irrigation companies and acreages. 10.3 Agricultural Lands Salt Lake County's master plan, published in March of 1965 and using 1960 land use data, identified 93,000 acres of total agricultural lands and 57,000 acres of urban lands. The plan does not identify how much of the agricultural ground was irrigated or dry farmed. A study for the Division of Water Resources, titled Land Use Inventory of Salt Lake County 1982, used 1979 infrared aerial photography to map various land use types. It identified 94,500 acres of urban ground, 51,200 acres of irrigated lands, and 27,400 acres of dry farm land. The total agricultural ground was 78,600 acres. The Division of Water Resources mapped the Salt Lake Valley in 1988 from low altitude photography with field verification. The results of that inventory were published in March of 1994, titled Water- Related Land Use Inventories - Lower Jordan River. The study identified 29,800 acres of irrigated ground, 23,100 acres of dry cropland for a total of agricultural land of 52,900. Urban land had increased to 116,100 acres. A comparison of the 1960, 1979, and 1988 data can be seen in Table 10- 1. These three studies, however, used different methods to collect data and different personnel to evaluate the data. In an effort to develop a more reliable model of the changing land use patterns, the Division of Water Resources re- inventoried Salt Lake Valley in 1994, collecting data and evaluating it with the same personnel and by the same methods used in 1988. The 1994 land use inventory has not been published, but the data ( also shown in Table 10- 1) showed urban lands had increased to 127,300 acres while irrigated farm ground had decreased to 25,300 acres and dry farm land had decreased to 18,600 acres. Total agricultural land was 43,800 acres. The changing land use patterns reflected by the 1988 and 1994 inventories confirmed the trends indicated by the earlier studies. Projected land use figures in Table 10- 1 for the year 2020 were developed based upon the pattern established by the four studies. Land use data presented in Table 10- 1 are also graphically illustrated in Figure 10- 1. Total agricultural lands have diminished from 93,000 acres in 1960 to 43,800 acres in 1994, and are projected to decrease to about 15,000 acres by the year 2020. Over the same period of time, urban lands have increased from 57,000 acres in 1960 to 127,300 acres by 1994. At that pace, urban lands will increase to over 175,000 acres by the year 2020. Despite the current trend of agricultural lands being converted to residential and commercial uses, a number of successful farming operations continue to flourish amidst the growing urban community. In the 1950s, a " nuisance" statute was passed. That law allows a resident, using his land for the same purpose for which it had been used historically, to remain on his land even though the uses of the land and population around have changed. This law allows the " urban" farmers to continue to operate their business. In the end, however, the " urban" farmer may quite possibly be doomed to extinction. The residential and commercial growth will ultimately escalate land and water values to the point that selling out to developers may prove to be the most financially prudent thing to do. One exception to the growing urban trend is the creation of relatively small 5- to 10- acre " ranchettes." These home developments are popular in the southern end of the valley, primarily in the Riverton and Bluffdale area, and provide horse enthusiasts with a rural setting in close proximity to city dwelling. At many of these sites, the home owner may continue to grow alfalfa or pasture to defray the cost of horse feed. 10.3.1 Irrigated Cropland The 1994 water- related land use inventory shows irrigated cropland has decreased to 25,300 acres. The crop type and distribution of the irrigated crops are given in Table 10- 2. The vast majority of irrigated lands are used for the production of feed for cattle. Irrigated pasture lands account for 36 percent, while alfalfa makes up 27 percent of the irrigated ground. Various grains, corn, hay, idle and fallow ground make up much of what remains. Less than 2 percent of the irrigated ground is used to produce higher cash crops such as fruits and vegetables. 10- 2 |