| OCR Text |
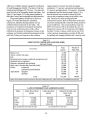
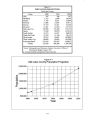
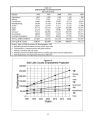
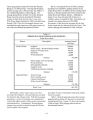
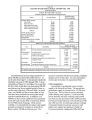
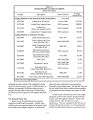
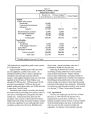
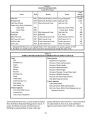
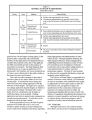
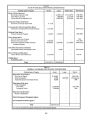
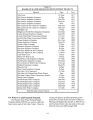
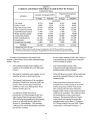
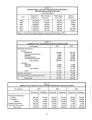
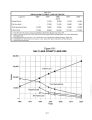
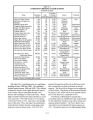
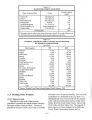
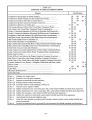
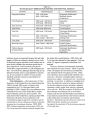
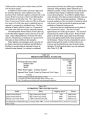
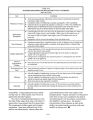
Show Table 9- 3 PROJECTED CULINARY M& I DEMAND AND SUPPLY FOR MAJOR WATER SUPPLIERS Jordan River Basin Population Water Demand Water Supply Surplus Projection ( acre- feet) ( acre- feet) Deficit 0 1995 805,000 255,700 348,360 92,660 2000 871,400 279,600 348,360 68,760 2005 958,000 308,500 348,360 39,860 2010 1,078,200 345,600 348,360 2,760 2015 1,199,800 384,100 348,360 ( 35,740) 2020 1,300,100 419,300 348,360 ( 70,940) Source: Wasatch Front Demand/ Supply Computer Model ( February 1997) Table 9- 4 CURRENT USES AND PROJECTED WATER DEMANDS Use Category 1995 2020 Municipal & Industrial: Culinary Residential Commercial/ Institutional Industrial Private Domestic Self- Supplied Industrial ( sub- subtotal) Secondary Municipal Industrial ( sub- subtotal) Total 164,600 77,200 15,400 24,600 26.500 308,300 10,000 13.200 23,200 331,500 261,500 135,000 25,300 20,000 26.500 468,300 15,000 13.200 28,200 496,500 Irrigated Agricultural 126,500 50,000 Developed Wetlands and Waterfowl Areas 94,500 94,500 Basin Total 552,500 _ 641,000 _, Table 9- 5 JORDAN RIVER BASIN TOTAL WATER DIVERSIONS AND DEPLETIONS Use Category 1995 2020 2050 Diversions Depletions Diversions Depletions Diversions Depletions Municipal and Industrial Culinary Secondary Subtotal Irrigated Agriculture Wet/ Open Water Areas Basin Total 308,300 23,200 331,500 126,500 94,500 552,500 130.950 14,900 145,850 50,600 94,500 290,950 468,300 28,200 496,500 50,000 94,500 641,000 216,290 17,690 233,980 20,000 94,500 348,480 738,000 35,000 773,000 5,000 94,500 872,500 369,000 21,000 390,000 2,000 94,500 486,500 9- 5 |