| OCR Text |
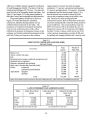
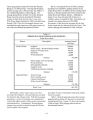
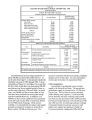
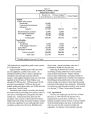
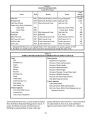
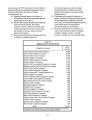
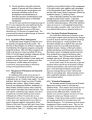
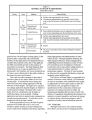
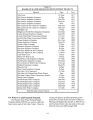
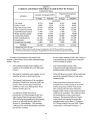
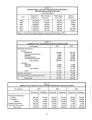
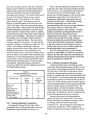
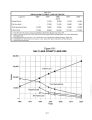
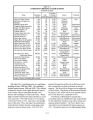
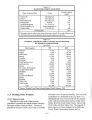
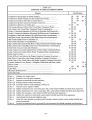
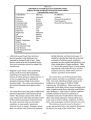
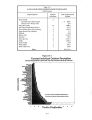
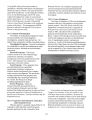
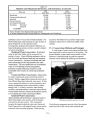
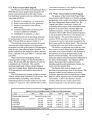
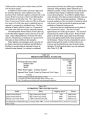
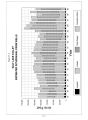
Show Table 12- 4 DIVISION OF WATER QUALITY SAMPLING SITES JORDAN RIVER SUB- BASIN INTENSIVE MONITORING PARAMETERS ANALYZED CHEMISTRY METALS NUTRIENTS Bicarbonate Aluminum Ammonia Calcium Arsenic Dissolved Nitrate& Nitrite Carbonate Barium Total Phosphorus Carbonate Solids Cadmium Dissolved Total Phosphorus Carbon Dioxide Chromium Chemical Balance Copper Chloride Iron Hydroxide Lead Magnesium Manganese pH Mercury Potassium Selenium Sodium Silver Specific Conductance Zinc Sulfate Total Alkalinity Total Dissolved Solids Total Hardness Total Suspended Solids Turbidity Little Cottonwood Creek from the Forest Service boundary to the headwaters are impacted by elevated levels of zinc. Again, historic mining areas are the probable source. Zinc levels exceed the criteria for aquatic life classification. Bingham Creek, which is only used during spring runoff, has been labeled partially supporting of its aquatic life classification because of metals, primarily copper and zinc. It is also non- supporting of its agricultural designation because of high levels of total dissolved solids. The sources are mining sites in the Oquirrh Mountains and irrigation return flows. The Jordan River from Utah Lake to 6400 South has been impacted by Total Dissolved Solids ( TDS). The primary sources of the TDS are water releases from Utah Lake and urban runoff. Of the pollution parameters monitored during this study, dissolved solids was the largest contributor to water quality impairment, followed closely by metals. Running a distant third was nutrient loads, followed by sediment, habitat alteration and dissolved oxygen. It should be noted that the study did not include evaluation of coliform counts, a pollution parameter previous studies had indicated as one of the Jordan River's biggest problems. Table 12- 5 shows the greatest sources of water quality impairments to the Jordan River are resource extraction ( erosion), urban runoff, reservoir releases, agriculture and recreation. The Jordan River and Tributary System Water Quality Update and Study was published in January 1986. This study identified coliform counts in the Jordan River in the range of 10,000 to 50,000 organisms per 100 milliliters. Many sources are responsible for the high coliform counts including farm waste, irrigation return flows, and urban runoff ( storm drain discharges). High levels of coliform organisms probably represent as much of a restriction to reclamation and reuse of Jordan River water as any other water quality parameter. Because there are so many sources of these indicator organisms, it follows that a clean- up program would be extensive and costly. The minimum observed values for dissolved oxygen are generally below state standards throughout the entire lower reach of the Jordan River. These 12- 7 |