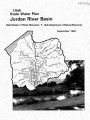
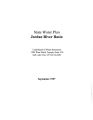
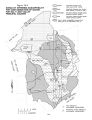
OCR Text |
Show Table 11 - 1 COMMUNITY DRINKING WATER SYSTEMS ordan River Basin Monthly Name Population Total Demand Source Treatment served Connections ( acre- feet) Alta Town Water System 500 53 21.65 Tunnel None Bell Canyon Irrigation Co. 1,440 450 44.19 Wholesale - Bluffdale 1,400 517 29.46 Wholesale - Boundary Spring WUA 120 30 2.32 Spring Chlorination Copperton Improvement Dist. 800 277 51.36 Wells Chlorination Draper City Water System 200 75 9.04 Wholesale None Draper Irrigation Co. 5,200 1,850 243.04 Well/ Stream Complete Foothill Water Co. 220 60 7.36 Wells None Granger- Hunter Imp. Dist. 85,000 22,000 184.12 Wells/ Wholesale None Herriman Pipeline Co. 900 210 25.78 Spring/ Well Chlorination Holladay Water Co. 14,900 3,705 434.53 Well/ Spring/ Wholesale Chlorination Kearns Imp. District 32,000 8,589 514.25 Wells/ Wholesale Chlorination Magna Water Co & Imp Dist. 21,500 5,562 438.81 Wells/ Wholesale Chlorination McDonald Condominiums 150 42 - Wells None Metro Water Dist. of SLC 700,000 40 911.00 Surface Complete Midvale City Water System 10,142 2,632 324.05 Wells/ Wholesale None Murray City Water System 31,000 7,956 125.24 Spring/ Well/ Wholesale Chlorination Riverton City Water System 12,000 3,028 206.22 Wells/ Wholesale None Salt Lake City Water System 285,258 83,000 920.61 Surface/ Wholesale/ Springs/ Wells Complete Salt Lake County Water 400,000 7,706 718.07 Surface/ Wholesale/ Complete Conservancy District Springs/ Wells Sandy City Water System 82,000 23,500 589.19 Wells/ Wholesale/ Spring Chlorination Silver Fork Pipeline 200 192 5.90 Tunnel None Silver Lake Company 640 130 6.90 Tunnel None Salt Lake Co. Area # 3 3,185 158 23.02 Springs\ Tunnel None South Jordan City 14,000 3,768 312.12 Wholesale None I South Salt Lake City 11,500 3,010 436.94 Wells None Spring Glen Water Co. 50 15 3.31 Wells None Taylorsville- Bennion WID 48,000 14,062 810.13 Wells/ Wholesale Chlorination University of Utah 18,000 1,125 - Well/ Wholesale None Webb Well Water Users 75 38 3.68 Wells None West Jordan Water System 45,000 42,892 743.85 Wells/ Wholesale None White City Water Co. 11,500 3,712 441.89 Wells/ Wholesale None Source: Division of Drinking W iter records. Salt Lake City's population grew at a rapid pace, doubling between 1880 and 1888. The population doubled again between 1900 and 1920. City officials continued to acquire water rights during this period in the nearby canyon watersheds through court decrees and exchanges for Utah Lake water. Water rights in Little Cottonwood Creek and Parley's Creek were acquired in 1912, Mill Creek in 1913 and Big Cottonwood Creek in 1914. Just prior to the drought years of the early 1930s, Salt Lake City established a water advisory board to develop a long- range water program to meet its future needs. The 1931- 1934 period of drought forced the city to drill more wells and to determine how best to increase its storage capacity. The Provo River Project was an outgrowth of these efforts. The Bureau of Reclamation initiated the project in the 1930s with its most notable feature, Deer Creek Reservoir, completed in 1941. The Bureau of Reclamation required that a contracting entity be established to take responsibility for the repayment of project costs and to operate and maintain project facilities. The Provo Water Users Association was incorporated for these purposes in 1935. During the same year, the Metropolitan Water 11- 2 |