| OCR Text |
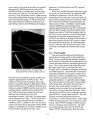
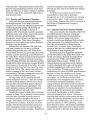
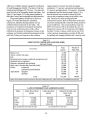
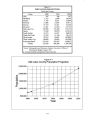
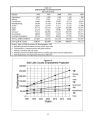
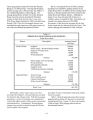
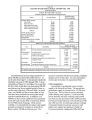
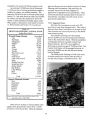
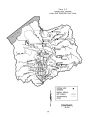
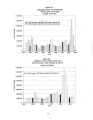
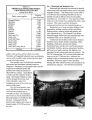
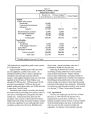
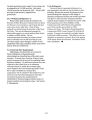
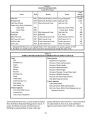
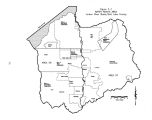
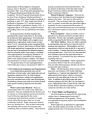
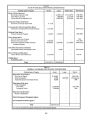
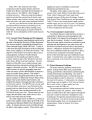
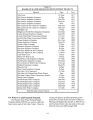
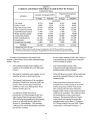
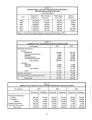
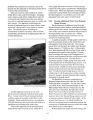
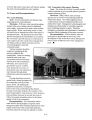
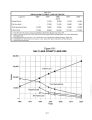
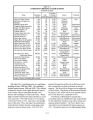
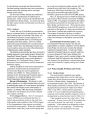
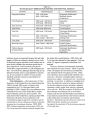
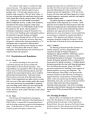
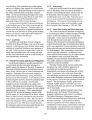
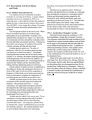
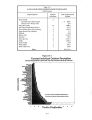
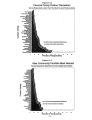
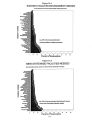
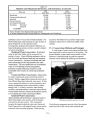
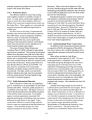
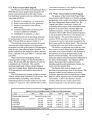
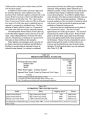
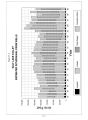
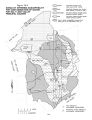
Show the highest of any county in the state. Reasons for Salt Lake County's net in- migration include healthy job growth relative to other nearby states and a cost of living that in recent years has been below the national average. The Wasatch Front Regional Council prepares city- level projections for Salt Lake, Weber, Davis, Morgan and Tooele counties with extensive review and comment from local communities. These projections are controlled to county level projections prepared by the Governor's Office of Planning and Budget and voted on by the regional council's board of directors. Once approved, they are then used to meet transportation planning requirements of the metropolitan planning organization. Projections are only to the year 2020 because that is the long- term horizon from which transportation decisions are made and modeled. These city- level projections, coupled with the Governor's Office of Planning and Budget county- level projections, provide consistent, systematically reviewed data for infrastructure planning along the Wasatch Front. Population projections from the Utah Process Economic Demographic ( UPED) model are desegregated down to traffic zones within cities and unincorporated communities in Salt Lake County by the Wasatch Front Regional Council. Peer review involving local community representatives was used to even out the results of the mathematical process. Table 4- 1 lists the federal census population counts of Salt Lake County's incorporated cities and unincorporated areas for 1990, and the OPB's population estimate for 1994 and projection figures for 2020. Additional extrapolations were made by the Governor's Office of Planning and Budget to help estimate long- range municipal and industrial water demands. Assuming a constant annual growth rate beyond the year 2020 of about 2.0 percent, the iMHnn.- ;::| ji;:": 5:::;:: t8&£ mftKBfWS ^ ^^.^ „.. jj;;;, E-?. fU ^ =• i hiJ: ^ ^ -: - iki••'-!• - ji<=- r; 50:: H L':: « *! « S ^::: -- i ... ^ gtt Ife fSSg% Salt Lake Valley from Ensign Peak, circa 1890 ( top) and in 1997. population of Salt Lake County could increase to over 2.36 million by the year 2050. 4.3 Employment Trade employment is projected to concentrate in Salt Lake City and the current growth areas of West Valley City, West Jordan and Sandy. Service job growth is expected to continue in these areas and to spread into future growth areas such as South Jordan, Riverton and Draper. Industrial employment is projected in West Valley City, West Jordan, western Salt Lake City and Salt Lake County. The construction industry has recently registered the biggest gains. These gains have been fueled by 4- 3 |