| OCR Text |
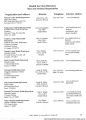
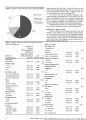
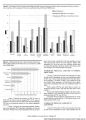
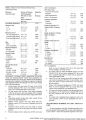
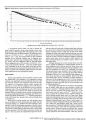
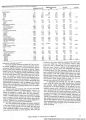
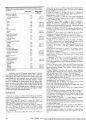
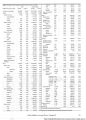
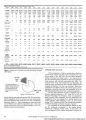
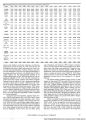
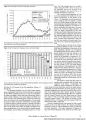
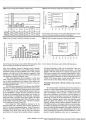
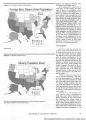
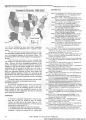
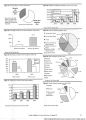
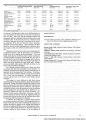
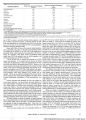
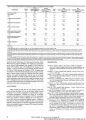
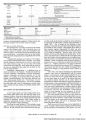
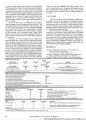
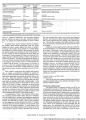
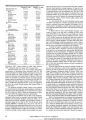
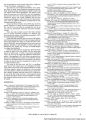
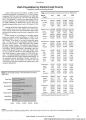
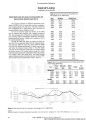
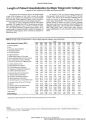
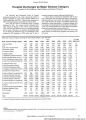
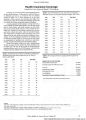
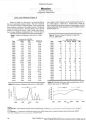
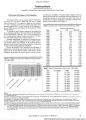
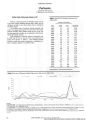
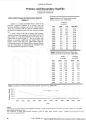
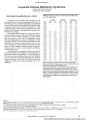
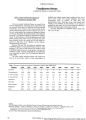
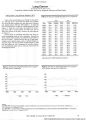
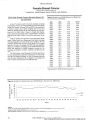
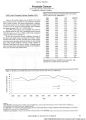
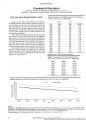
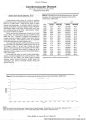
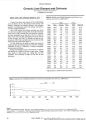
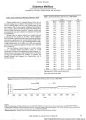
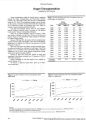
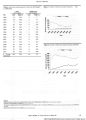
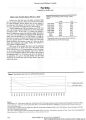
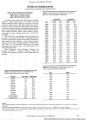
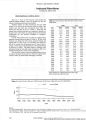
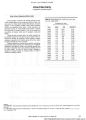
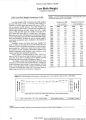
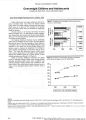
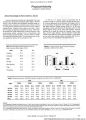
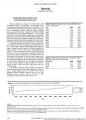
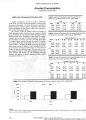
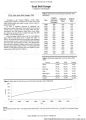
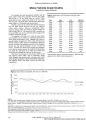
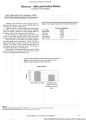
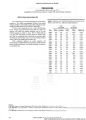
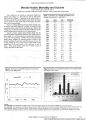
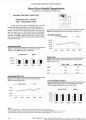
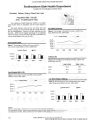
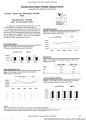
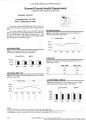
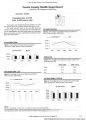
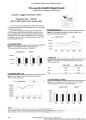
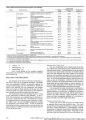
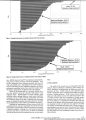
Show General Health Status Life Expectancy and All-Cause Mortality Compiled by Juliana Preston 2001 Utah Total Deaths: 13,033 Life expectancy at birth has been steadily increasing in Utah and the United States since 1970 (Table 1). In the U.S., life expectancy increased from 70.8 years in 1970 to 76.9 years in 2000. Utahns live about two years longer than other U.S. residents: the state's males can expect to live for 76.1 years, and Utah females to age 81.2 (Table 1). The trend in increased longevity has led to increased concern about the prevalence and treatment of chronic diseases. Health care expenditures are increasing, partially due to the fact that as people live longer, they require more health care services later in life. Healthy lifestyles can prevent many chronic diseases, and increase life expectancy. Utah's low smoking rates, and high exercise rates may account in part for the higher than average life expectancy enjoyed by Utahns. Total mortality rates reflect the overall health of a population, and include natural causes of death, disease, homicide, and death due to injury. In the last sixteen years, Utah's mortality rate has ranged from 85% to 91% of the national average (Table 2). The increase from 85% in 1990 to 91% in 1998 was due to a decrease in the national rate, rather than an increase in Utah's mortality rate. Utah males are dying at a considerably higher rate (200-300 more per 100,000 per year) than Utah females. Utah's highest mortality rates are in the Southeastern and the Tri-County health districts (Table 3). Table 1. Life Expectancy at birth in Years, Utah and U.S., 1970- 2001. Male Female Years Utah U.S. Utah U.S. U.S. Total 1970 69.5 67.1 76.6 74.7 70.8 1980 72.4 70.0 79.2 77.4 73.7 1990 74.9 71.8 80.4 78.8 75.4 1997 75.6 73.6 80.9 79.4 76.5 1998 75.7 73.8 81.0 79.5 76.7 1999 75.9 73.9 81.1 79.4 76.7 2000 76.0 74.1 81.2 79.5 76.9 2001 76.1 N/A 81.2 N/A N/A Table 2. Mortality per 100,000 Population from All Causes, Utah and U.S., 1985-2001.3 Utah U.S. Year Male 1985 1076 1986 1039 1987 1007 1988 1018 1989 998 1990 1016 1991 984 1992 969 1993 979 1994 954 1995 952 1996 939 1997 941 1998 938 1999 927 2000 910 2001 913 a Age-adjusted to Female Total Total 702 864 988 673 832 978 696 832 970 698 836 975 689 821 950 642 801 938 678 811 925 662 795 911 692 818 931 654 787 920 675 797 918 660 782 902 684 799 887 679 795 875 679 790 882 680 783 872 682 784 N/A 2000 standard population. Utah:U.S. 0.87 0.85 0.86 0.86 0.86 0.85 0.88 0.87 0.88 0.86 0.87 0.87 0.90 0.91 0.90 0.90 N/A Table 3. Mortality per 100,000 Population by Health District, Utah, 1999-2001.a Distrct 1999 2000 2001 District 1999 2000 2001 Bear River Central Utah Davis County Salt Lake County Southeastern Utah Southwest Utah 757 770 714 Summit County 559 731 759 814 825 841 Tooele 783 938 784 817 761 754 Tri-County (Uintah Basin) 845 888 917 800 801 812 Utah County 774 757 766 826 786 893 Wasatch County 723 771 855 836 676 648 Weber-Morgan 794 838 856 Sources: Utah 1985-2001: Utah Department of Health, Center for Health Data. Indicator-Based Information System for Public Health [Online] htto:// feMfejKjiigo^bis-Bh/. Retrieved 3/10/03 State of Utah. Governor's Office of Planning and Budget. Demographic and Economic Analysis. [Online] lucp^goyeraor.utah.goy/dea/defnoayaphjcs/ hjiab 1 o abje,him!. Retrieved 3/10/03 U.S. 1985-1999: U.S. Department for Health and Human Services. Public Health Service, Centers for Disease Control and Prevention. CDC Wonder. [Online] gttfg:.'/wonder.cdc.^.ov/. Retrieved 3/10/03 2000: U.S. Department for Health and Human Services. Public Health Service. Centers for Disease Control and Prevention. Mortality Data from the National Vital Statistics System. [Online] hjLi. -^v ,sk_;\\- , , - . , 1.J _> Retrieved 3/10/03. 72 Utah's Health: An Annual Review Volume DC |