| OCR Text |
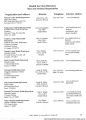
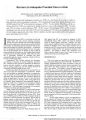
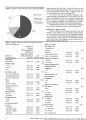
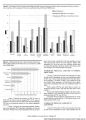
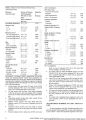
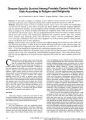
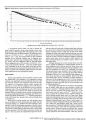
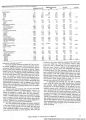
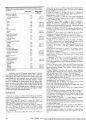
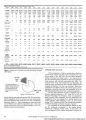
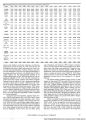
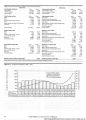
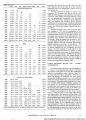
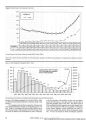
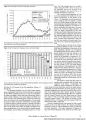
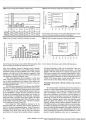
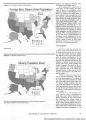
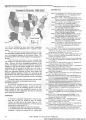
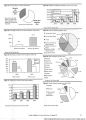
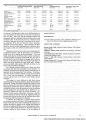
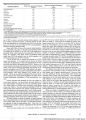
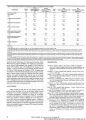
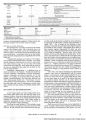
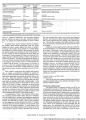
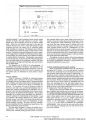
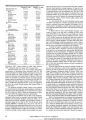
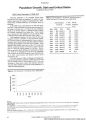
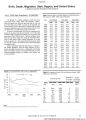
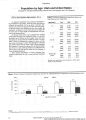
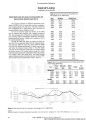
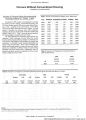
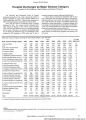
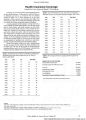
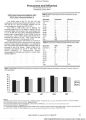
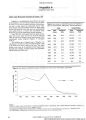
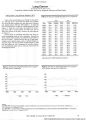
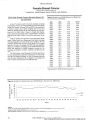
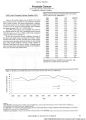
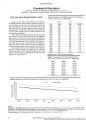
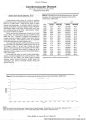
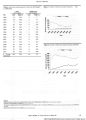
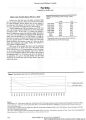
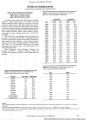
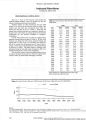
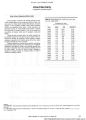
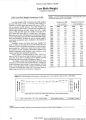
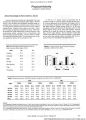
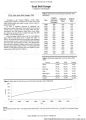
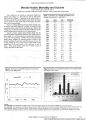
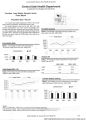
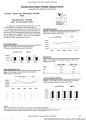
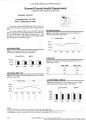
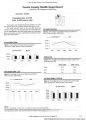
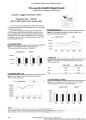
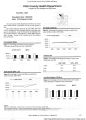
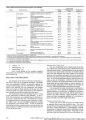
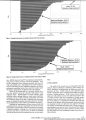
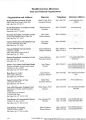
Show Population Birth, Death, Migration: Utah, Region, and United States Compiled by Gretchen Ratzlaff and Clint Thompson July 1. 2002 Utah Population: 2,316,256* The growth of a resident population results from three influencing factors: births, deaths, and migration Table 1 shows the growth rate, birth rate and death rate for Utah and the United States since 1960. In terms of net-migration, the southern portion of the United States is experiencing the largest increase in population due to this factor, followed by the western, Midwestern, and northeastern portion of the nation. In terms of overall growth, the West has experienced the fastest rate of growth over the past decade. Five of the eight Mountain States experienced the fastest rates of growth in the nation from 1990 to 2000 (Table 2). Utah has the highest crude birth rate and lowest death rate among the Mountain States, both of which reflect Utah's younger population, yet is only fourth in growth rate. This means the top three growth states (i.e. Nevada, Arizona, and Colorado) have experienced higher net-migration rates. With a consistently high birth rate (Figure 1) and generally healthy population, Utah will likely continue to face a growth rate higher than most states. Additionally, the Western States will continue to grow at a comparatively high rate as the national population continues to migrate in the southern and western directions. Figure 1. Crude Birth Rate, Utah and U.S., 1960-2001. 35 -| ----------Utah - - u.S. 30 Table 1. Growth, I 3irth, and Death Rates per 1,000 Population, Utah anc 1 U.S., 1960 - 2001 (Julyl estimates). Year Growth Rate Birth Rate Death Rate Utah US Utah US Utah US 1960 33.3 N/A 29.2 23.7 6.7 9.5 1965 13.1 N/A 22.5 19.4 6.7 9.4 1970 17.8 N/A 25.3 18.4 6.6 9.5 1975 30.0 N/A 25.6 14.6 6.1 9.3 1980 39.3 11.1 28.3 15.9 5.5 9.4 1985 12.8 9.1 22.8 15.8 5.5 8.8 1986 12.0 9.0 21.9 15.6 5.3 8.8 1987 8.9 9.1 21.0 15.7 5.4 8.8 1988 7.1 9.2 21.3 16.0 5.4 8.9 1989 9.4 9.9 20.8 16.4 5.4 8.7 1990 13.4 10.2 21.0 16.7 5.3 8.6 1991 29.0 11.5 20.2 16.3 5.4 8.6 1992 31.2 11.4 20.2 15.9 5.3 8.5 1993 27.1 10.1 19.6 15.5 5.5 8.8 1994 29.4 9.5 19.7 15.0 5.3 8.8 1995 24.3 9.3 19.8 14.8 5.4 8.8 1996 23.3 9.5 20.6 14.7 5.4 8.7 1997 26.9 9.5 20.5 14.5 5.5 8.6 1998 19.7 9.1 21.1 14.6 5.5 8.6 1999 23.4 8.9 21.1 14.5 5.5 8.6 2000 23.8 8.1 21.1 14.8 5.5 8.8 2001 21.5 6.5 20.8 14.5 5.6 S.7 2002 14.9 5.6 20.5 14.1 5.7 8.5 Table 2. Comparative Growth, U.S. and Mountain States, 1980-2000 (July 1 estimates). o o 25 - o H 20 - <D Q. 15 - 10 - 5 -| 0 1960 1970 1980 Year 1990 2000 Percent Growth State Rank by Growth Crude Birth Rate State 1980-1990 1990-2000 1990-2000 1999 U.S. 9.8 13.1 14.5 AZ 34.8 40.0 2 17.0 CO 14.0 30.6 3 15.3 ID 6.7 28.5 5 15.9 MT 1.6 12.9 20 12.2 NV 50.1 66.3 1 16.2 NM 16.3 20.1 12 15.6 UT . 17.9 29.6 4 21.1 WY -3.4 8.9 32 12.8 Source: ^ Utah's Health: An Annual Review Volume DC 63 |