| OCR Text |
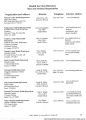
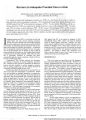
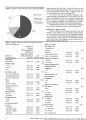
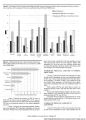
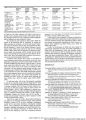
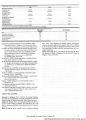
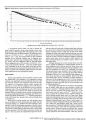
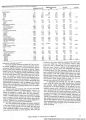
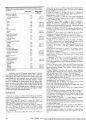
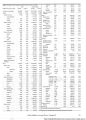
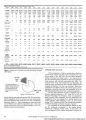
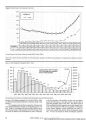
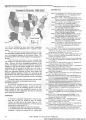
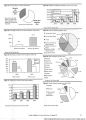
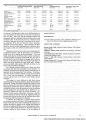
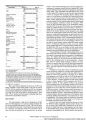
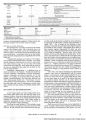
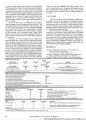
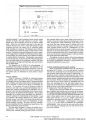
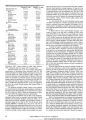
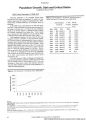
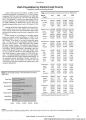
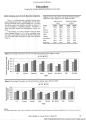
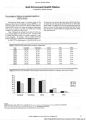
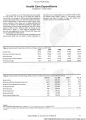
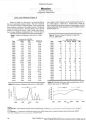
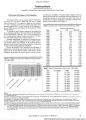
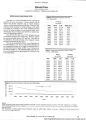
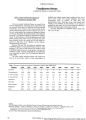
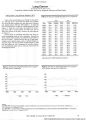
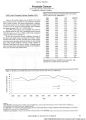
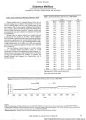
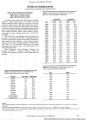
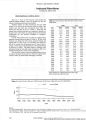
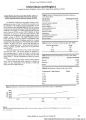
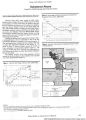
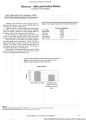
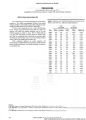
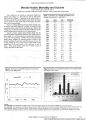
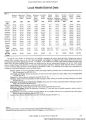
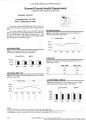
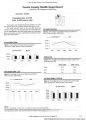
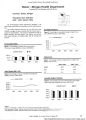
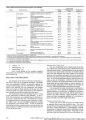
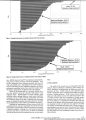
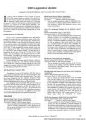
Show Population Population Growth: Utah and United States Compiled by Royce Webb 2002 Utah Population 2,338,761 Measuring population is very important because many decisions are made based on population. The number of state residents determines the number of congressional seats. Many federal funds, including Medicaid, are distributed based on population. In the 2000 census, Utah ranked as the 34th most populated state. Utah experienced some of the most rapid growth in the nation (2.63% per year vs. 1.24% for the U.S.) during the decade of the nineties (Figure 1), although Nevada, Arizona, and Colorado experienced even higher rates. Utah's annual rate of increase has been dropping in the new decade, being 1.90% from 2001 to 2002, the lowest since 1990. (Table 1) Utah population estimates are those made by the Utah Population Estimates Committee, a state government committee of persons expert in understanding the Census, school enrollments, motor vehicle licenses, and other indicators useful in estimating the population of the state and its counties. These estimates differ slightly from those of the U.S. Census (for 2002 the Committee estimate of 2,338,761 is 22,505-just less than 1%-above the Census estimate of 2,316,256). The differences generally reflect differences in assessments of migration. Both sets of estimates proved to be low in comparison with the counts for the 2000 Decennial Census. [Perlich, Pamela S. 2001. Utah Economic and Business Review. 61:5-6 (May/June): 1-13] The Utah Governor's Office of Planning and Budget projects that the population in Utah will continue to grow over the next few decades, with 3,772,042 people by 2030. This poses challenges to health policy makers and healthcare providers, who must make decisions and provide needed healthcare to a rapidly increasing population. Table 1. Total Population in Thousands, and Percentage Increase, Utah and U.S., Selected Years, 1960-2002. Total Population 5 Year Utah as (thousands) Increase Proportion of U.S. Year Utah U.S. Utah 1960 900 180,671 NA 0.50% 1965 991 194,303 91 0.51% 1970 1,066 205,052 75 0.52% 1975 1,234 215,973 168 0.57% 1980 1,474 227,224 240 0.65% 1985 1,643 237,923 169 0.69% 1990 1,729 248,790 86 0.69% 1995 1,995 266,278 266 0.75% 2000 2,247 282,224 252 0.80% 2001 2,296 285,317 49 0.80% 2002 2,338 288368 42 N/A Figure 1. Total Population in Thousands, Utah, 1960-2000. 2500 -i 1 2000 -| m M J 1500 -| § 1000 - = 500 -\ Q. 2. . O ID CO CO 9 8 9 CD Ol 9 9 Year Sources: Utah 1960-2002: Utah Governor's Office of Planning and Budget (2003). 2003 Economic Report to the Governor. Salt Lake City: Government Printing Office. U.S. 1960-2001: U.S. Census Bureau.htip://facT.tinder.census.gov/servjet.'Ti^;>icFactsServiet. fatp://w\¥wxemus.gov/populatK)nA¥wWceii2000/ respop.html. http://dre.census.gov/popset/ciat3/bational/in.teicensal.php. bttp://eire.census,gov/popsa :\,&> js "- ) tos Re- trieved 7/1/2003. Historical Population Estimates: July 1, 1900 to July 1, 1999. Population Estimates Program, Population Division, U.S. Census Bureau, httpv/ eire.ceo.--i _j___'¦¦_. 62 Utah's Health: An Annual Review Volume DC |