| OCR Text |
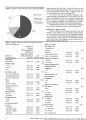
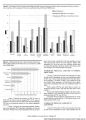
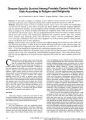
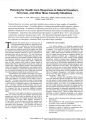
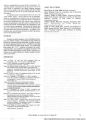
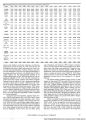
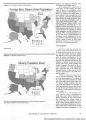
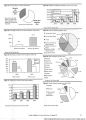
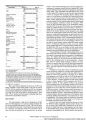
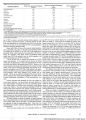
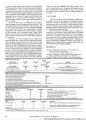
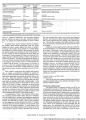
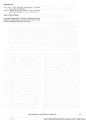
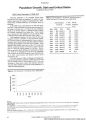
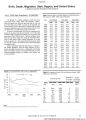
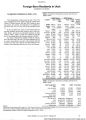
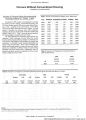
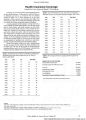
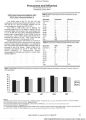
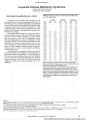
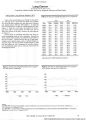
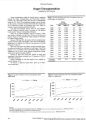
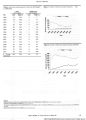
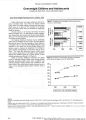
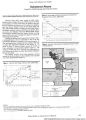
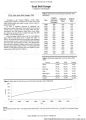
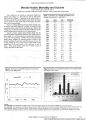
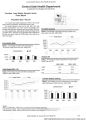
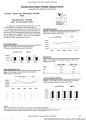
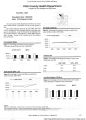
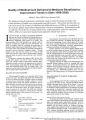
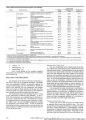
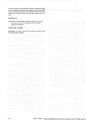
Show Figure 11. U.S. Foreign Born Share of the Population. Foreign Born Share of the Population 10.9to26.2% (12) 1 5.3to10.9% (12) 1 3 to 5.3% (12) ] 1 to 3% (15) 2000 Census Figure 12. U.S. Minority Population Share. Minority Population Share 32% to 77% (16) H 16% to 32% (17) ? 3% to 16% (18) Minority is the Hispanic population plus the non-white non-Hispanic population. Data: BEBR calculations from the 2000 Census. healthier Utah population (Hudman, 2000; Lillie-Blanton and Hudman, 2001). At the national level, research has already begun to better identify and understand the impact of race/ethnicity, culture, economic, legal, and other related forces and factors on healthcare and health status. A recent national study concludes that while race, ethnicity, generation, and immigration status all affect the health of children, differences in economic circumstance exert an even greater influence (Passel, 2002). The Office of Minority Health (OMH), which was established in 1985 within the U.S. Department of Health and Human Services, has made significant progress toward developing national standards for culturally and linguistically appropriate services in healthcare (IQ Solutions, 2002). Given the increasing diversity of Utah and the crucial importance of developing cultural competence in the design and delivery of healthcare programs and services, further research on these topics specifically focused on Utah would be a great service to the people of the state. CONCLUSIONS Diversity in Utah has increased substantially in the 1990s primarily because of the immigration of persons from Latin Amer---- ica. Utah has become much more racially and ethnically diverse in the 1990s. Numerically, the greatest contribution to this has been the international immigration of His-panics to Utah, especially from Mexico. This migration is national in scope and also has brought more Asians, Pacific Islanders, and Eastern Europeans. The growth of the minority population has been significantly more rapid than that of the White non-Hispanic majority. In fact, one out of every three new Utah residents in the 1990s was a minority person. Regions of origin have changed for the Utah foreign-born population. Latin America is the source region for 55.4 percent of the Utah foreign-born population in 2000. Asia is the second largest source region with 17.9 percent. Europe contributed 16.2 percent of the 2000 foreign-born population of Utah, with significant increases from Eastern Europe. Western and Northern Europe were the majority source regions for all previous census counts. Political forces and economic cycles affect migration patterns. International political issues have affected migrations of diverse populations to Utah. Post-Vietnam War Southeast Asian refugees settled in Utah in the 1980s. The collapse of Eastern Block countries brought Serbians and others. Family reunification, employment, and political refugee status became the most recent principles governing immigration to the Utah's Health: An Annual Review Volume LX 33 |