| OCR Text |
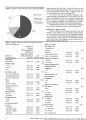
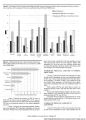
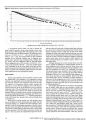
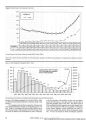
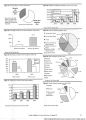
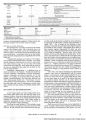
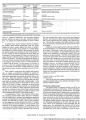
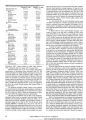
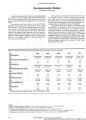
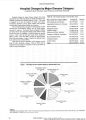
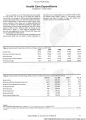
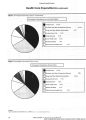
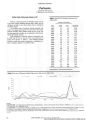
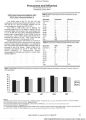
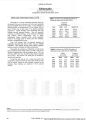
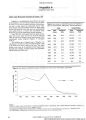
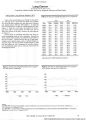
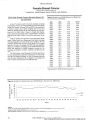
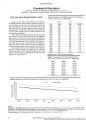
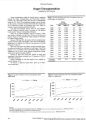
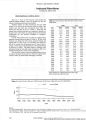
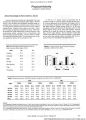
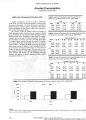
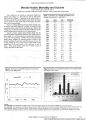
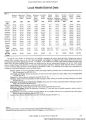
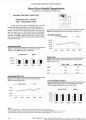
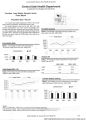
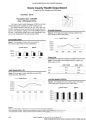
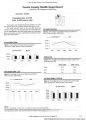
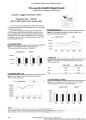
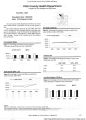
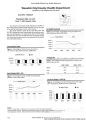
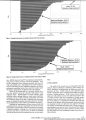
Show Figure 5. Source Regions of Utah's Foreign Born Population. 100,000 - 90,000 - ab 80,000 - .2 60,000 - a. ¦op '2? o 50,000 - 30,000 - 20,000 - 10,000 - EUROPE ASIA AFRICA OCEANIA LATIN AMERICA NORTH AMERICA Source: Bureau of the Census, Jensen (1994), BEBR Calculations. (Note: Individuals not otherwise classified are omitted from the figure.) Figure 6. Utah's Foreign Born Population: Shares by Source Region. 10% - ? EUROPE H AFRICA ? LATIN AMERICA i ASIA M OCEANIA ? NORTH AMERICA Source: Bureau of the Census, Jensen (1994), BEBR Calculations. (Note: Individuals not otherwise classified are omitted from the figure.) cent. The Utah population grew by over half a million during the 1990s. About 35 percent of this population increase has occurred in the minority population, and much of this is in-migration of Hispanics. (Figure 19) This American Indian population of Utah is the only population that could never be considered "foreign-born" by the Bureau of the Census. Hie population was not represented in census counts for well over a century, hi 2000, there were 29,684 persons in Utah who identified themselves as American Indian alone while 40,445 identified themselves as American Indian in combination with other races. For many decades the American Indian population of Utah was highly concentrated in San Juan (Navajo) and Uintah (Uintali and Ouray) counties, which together accounted for 78 percent of the American Indian population of the state by 1910. By the 2000 census, the share of the state's American Indian population in Salt Lake and San Juan counties was nearly equal. Presently, this is not a rapidly growing population in Utah. There has been an increase in the African foreign-born population in Utah over the 1990s. While this has contributed to the growth of the Black population, domestic net in-migration and natural increase are the primary sources of growth. Blacks have been and continue to be underrepresented in Utah with less than one percent of the population as compared to 12.3 percent nationally. In the past they have come to the state for work, particularly with the military and the railroad. During the Great Depression there was an out-migration of Blacks from the state (Ulibarri, 1972). The federal defense sector build-up in Utah beginning in the 1940s employed many African Americans. The number of persons identifying themselves as "Black, African American, or Negro" alone in the 2000 census was 17,657, an increase of 52.5 percent over the 11,576 count of 1990. This is more than double the growth rate of those persons identifying themselves as White alone over the same period. The number of Asians and their regions of national ori%in corresPond with me Asian race categories in the census. Consequently, the number of Asians increased in the 1860s. de- fell from 91 to 85 percent of the Utah population. (Figures 14 through 18) The Hispanic population is by far Utah's largest minority group, composing 61 percent of all Utah minorities. Considering the non-White population (who may or may not be Hispanic), the largest race group is Some Other Race (40 percent), which is almost entirely Hispanic. The second largest non-White race group in Utah is the multiracial group, which was selected by one in five persons in the non-White population. The next largest group is Asian (15 percent), followed by American Indian (12 percent). Black or African American (7 percent), and Native Hawaiian and Other Pacific Islander (6 percent). What is clear is that over the decade of the 1990s, the White non-Hispanic majority population grew by 21 percent while the minority population (Hispanic and non-White non-Hispanic) grew by 117 per- clined during the Great Depression, and did not again increase substantially until after World War II and the passage of several important immigration laws that allowed more free entry of Chinese to the United States. More recently, persons of Chinese origin were among the Vietnamese refugees after 1975. Students from the People's Republic of China, Hong Kong, and Taiwan have come to Utah in increasing numbers and some of these eventually became citizens. The number of persons in Utah indicating Chinese or Taiwanese only on the census of 2000 was 8,045 (Conley, 1994). (Figure 20) Persons of Japanese descent were present in Utah in small numbers early in the 20th Century. The Japanese population increased to 3,269 in 1930 but declined to 2,210 by 1940 with the Great Depression. The largest migrations of Japanese to Utah were forced migrations in the decade of the 1940s, espe- Utah's Health: An Annual Review Volume DC 31 |