| OCR Text |
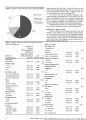
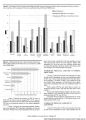
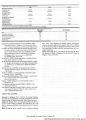
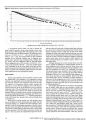
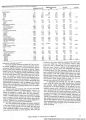
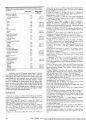
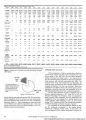
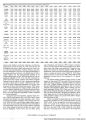
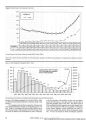
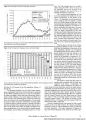
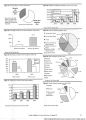
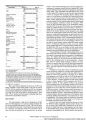
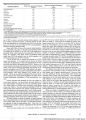
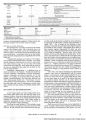
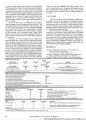
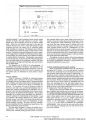
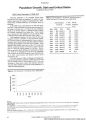
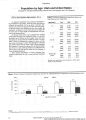
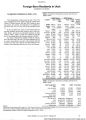
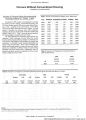
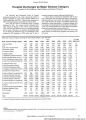
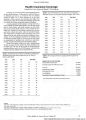
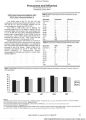
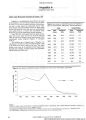
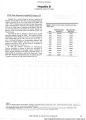
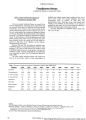
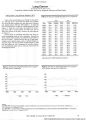
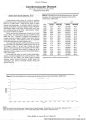
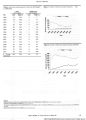
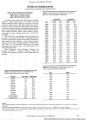
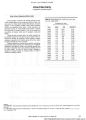
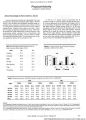
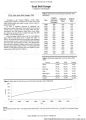
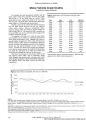
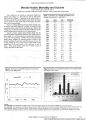
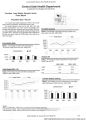
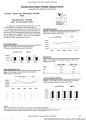
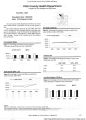
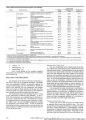
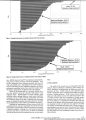
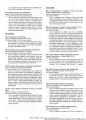
Show Figure 3. Minority Share of the Population: Utah & US. 35% 30% - 25% - 20% - 15% - 10% -, 1850 1860 1870 1880 1890 1900 1910 1920 1930 1940 1950 1960 1970 1980 1990 2000 15.7% 14.4% 12.9% 13.5% 12.5% 12.1% 11.1% 10.3% 10.2% 10.2% 10.5% 11.4% 16.8% 20.4% 24.4% 30.9% Hg -Utah 0.4% 0.4% 0.9% 1.1% 1.0% 1.5% 1.8% 1.7% 1.6% 1.3% 1.7% 1.9% 5.5% 7.6% 8.8% 14.7% Sources: Bureau of the Census, Gibson and Jung (2002), Perlich (2002). Note: Prior to 1970, minority is non-White. For 1970 and beyond, minority is non-White (may be Hispanic or non-Hispanic) plus Hispanic (may be of any race). Foreign Born Population: 1850 - 2000. Undocumented in 2000 = 65,000 or 41% of the foreign born population and 1% of total population. 0% 180,000 160,000 140,000 c 120,000 100,000 roreign Bor 80,000 60,000 .a 40,000 20,000 0 1850 1860 1870 1880 1890 1900 1910 1920 1930 1940 1950 1960 1970 1980 1990 2000 Sources: Bureau of the Census, Immigration and Naturalization Service, BEBR Calculations. percent) of the Hispanic population in Utah from 1990 to 2000, two-thirds of whom identify themselves as Mexican (Table 4 and Figure 3). The changing racial and ethnic composition of the state has been mainly determined by changes in immigration patterns over time. (Table 5) According to the census counts. Whites were at least 98 percent of the Utah population from 1850 through 1960. Of course the Whites were out-numbered by Native Americans in the early decades of the territory, but they were not enumerated in the 1850 census. In fact, there was not a serious effort to count this population until at least 1920. The official count of Whites indicated that their proportion in the total dropped steadily to reach 94 percent in 1990 as the populations of Hispanics, Asians, Pacific Islanders, African Americans, and others increased more rapidly than did the White non-Hispanic population. Over the last decade the White non-Hispanic population 30 Utah's Health: An Annual Review Volume DC |