OCR Text |
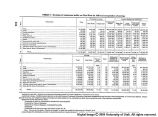
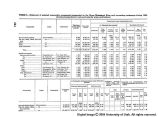
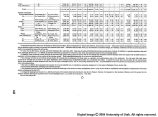
Show TABLE 8.-Statement of selected commodity movements transported on the Upper Mississippi River and connecting waterways during 1948, showing transportation costs and rates by water and railroad 444 Constructed water transportation costs Total tons Ton-miles (a) Line-haul plus terminal Line-haul port-to-port Commodity Origin Destination carried (2.000 Ton-miles pounds) (water) Total cost Plus public cost (d) per ton-mile Per ton Plus public cost Total cost t0*£ile foenr Mills Mills Iron and steel products............ All movements............................. 88,630 99,357,101 $453,981 $9,469 4.669 $5.12 $6.08 $269,631 2.714 $3.04 Pig iron, skelp, billets, iron and .....do..-.................................... 47,586 81,661,053 357,349 9.276 4.376 7.51 8.47 311,191 3.811 6.54 steel. Sulfur...................-------------------do......._____......................... 375,577 578,801,808 2,372,911 9.000 4.100 6.32 7.28 2,136,297 3.691 5.69 Grain. -..........................-..do_____________________......____ 129,586 84,838,362 295,402 8.382 3.482 2.28 3.24 219,028 2.682 1.69 Coal, bituminous................._____do___________......__________...... 1,149,175 629,225,079 2,094,263 8.228 3.328 1.82 2.78 1,841,443 2.927 1.60 Total.........------------.............................................___ '1,790,554 1,473,883,403 5,573,906 8.682 3.782 3.11 4.07 4,777,590 3.241 2.67 Specific movements: Iron and steel products.......... Evansville, Ind..... St. Paul, Minn____ 1,345 1,384,005 7,856 10.576 5.676 5.84 6.80 5,059 3.655 3.76 Do.......................... St. Louis, Mo....... Minneapolis, Miss.. 1,141 767,893 5,158 11.617 6.717 4.62 3.48 2,785 3.627 2.44 Do.......................... East Chicago,Ind... New Orleans, La___ 13,098 18,599,160 70.818 8.708 3.808 5.41 6.37 43,574 2.343 3.33 Sulfur........................... Port Sulphur,La.... Clinton, Iowa....... 2,352 3,393,936 14,391 9.140 4.240 6.11 7.07 12.909 3.804 5.49 Do.................____________do......-....... Chicago.m......... 95,275 140,054.650 690,012 9.113 4.213 6.19 7.15 529,989 3.784 5.56 Do-.................____ Qalveston, Tex...........do............... 204,669 330,745,104 1,324,546 8.905 4.005 6.47 7.45 1,195,605 3.615 5.84 Grain: Corn.......................... New Boston, 111..... New Orleans, La.-- 1,113 1,449,126 3,842 7.551 2.651 3.45 4.41 3,129 2.159 2.81 Oats.......................... Minneapolis, Minn. Memphis, Tenn..... 1,422 1,541,448 4,542 7.847 2.947 3.19 4.15 4,031 2.615 2.83 Wheat........................ Burlington, Iowa-. St. Louis, Mo....... 4,365 977,760 5.952 10.987 6.087 1.36 2.32 3,222 3.275 .73 Coal, bituminous............... East St. Louis, 111... Minneapolis, Minn. 3.233 2,175,809 7,069 8.149 3.249 2.19 3.15 6,358 2.922 1.97 Do..............._______ Alton, 111............ LaOrosse, Wis...... 2.469 1,222,155 4,165 8.308 3.408 1.69 2.65 3,622 2.964 1.47 Do.............. ... Liverpool, 111 . , , .. St. Paul, Minn . 2.085 1,565,835 4,934 8.051 3.151 2.37 3.33 4,480 2.861 2.15 (^EstimatedraUtran^portationcosts (Edward's p ^ed ^^ ^ transpOrtation costs ---------------------------------------------------------------- vSedtotoTlars'pe; excluding passenger service and 1. c. 1. Line-haul plus terminal Line-haul only net ton Commodity Origin Destination T°5a™)leS RaU Portion Remaining costs Total F™ Per Total ?J? Per Water Esti- Per- L^ cost ml]; ton cost mu; ton (.) ? mated cent p mile rent mal total ton level («) (*) Mills Mills Iron and steel products.. Allmovements.....................- 71,062,636 $776,805 10.931 $8.76 $652,812 9.186 $7.36 ...............______ 11.8 $91,663 $685,142 $7.73 9.64 Pig Iron, skelp, billets, .....do................................ 56,449.245 554,927 9.831 11.66 484,012 8.574 10.17 .....................- 11.8 65,481 489,446 10.29 8.67 iron, and steel. Sulfur........................do______....._____............ 475,632,772 3,924,745 8.252 10.45 3,500,441 7.360 9.32....................... 11.8 463,120 3,461,625 9.22 7.28 |