OCR Text |
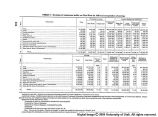
Show Rate of Investment The program would be set up for 6-year pe- riods, and for longer range-say 10 and 20 years. The rate of investment would be determined by the urgency of need in the various regions, and by the availability of funds for development purposes. In addition to scheduling the rate of invest- ment, the budget statement might indicate the relationship between Federal water and land re- sources development expenditures and total Fed- eral expenditures. They might also be compared with the gross national product, gross private in- vestment, or the requirements for some other Fed- eral functions, such as defense, public health and welfare, education, and roads. These relation- ships would, of course, be matters for considera- tion not by the Board of Review, but by the Coun- cil of Economic Advisers, the Bureau of the Bud- get, and by the President and Congress. An example of the suggested procedure is shown in table 3, which indicates how Federal water resources investment expenditures before and after World War II compared with total Federal expenditures, gross national product, gross private domestic investment, and total Fed- eral investment. The 1951 figures in the table are based on the pre-Korean War budget. Since the outbreak of the war, the estimates for water resources development have been materially re- duced both in amount and proportion of the total. The proportion of total Federal expenditures provided for water resources development reached a high of 4.1 percent in 1938. During the war this proportion declined rapidly. Since the war it has increased again, until the pre-Korean War budget figure totaled 3.1 percent. The pre-Korean War budget figure is used in the table to indicate the continuation of the up- ward trend of water resources expenditures. After the beginning of the war the general appro- priation bill for 1951, as enacted, reduced the amount for water development, and further cuts TABLE 3.-Federal expenditures for water resources development [Fiscal years-Millions of dollars] 1936 1937 1938 1939 1940 1947 1948 1949 1950 1951 Army Engineers: Elvers and harbors____________ _____....... 93.9 104.2 99.0 76.8 61.5 87.7 113.7 159.0 210.0 241.0 Flood control 90.2 91.8 66.3 75.5 106.5 180.4 246.3 374.0 458.9 534 3 Bureau of Reclamation 49.3 40.3 62.7 77.0 93.7 92.6 150.6 208.2 307.4 354.4 Other Interior 2.8 48.2 1.3 40.1 4.6 43.7 10.7 38.3 16.3 39.1 21.2 32.9 20.0 48.1 28.1 47.1 44.2 78.9 58.1 117.9 TVA............................. Agriculture_____ ______ ____ 5.0 .2 4.1 1.3 4.6 2.3 4.7 1.4 4.2 1.9 5.0 1.6 5.7 1.4 6.2 2.9 11.4 5.4 12.4 Other___...... _ 11.4 Total for water resources____..........____........ 289.6 283.3 283.2 284.4 323.2 421.3 585.8 825.5 1,116.2 1,329.5 Total Federal expenditures in billions ._______ 8.5 3.4 77.4 .39 6.2 4.8 7.8 3.6 86.4 .33 8.2 3.7 7.0 4.1 87.4 .32 8.2 3.7 9.2 3.2 88.0 .32 8.4 3.6 39.3 3.5 96.4 .35 10.6 2.8 33.8 1.1 222.2 .19 26.8 1.5 40.1 1.7 246.2 .24 34.3 1.8 43.3 2.1 257.4 .32 37.2 2.2 7.7 43.3 2.6 259.7 .43 3a 6 2.8 9.9 42.4 Water resources expenditures as percentage of total Federal expenditures___ _^ „ 3.1 Gross national product in billions - - 276.0 .48 Water resources expenditures as percentage of total Federal expenditures__........_____________________________ Gross private domestic investment in billions .. 37.8 3.4 11.2 Water resources expenditures as percentage of total Federal expenditures___ ________________.__________________ Total Federal investment in billions Water resources expenditures as percentage of total Federal investment-. - . 10.4 11.1 11.6 Source: Ageney expenditures from Fiscal Divisio,n Bureau of the Budget. Federal expenditures, gross national product, and gross private domes- tic investment projections estimated in March 1950, assuming reasonably full employment and normal trends in labor productivity and hours of work per week, dross national product and gross private domestic investment figures from Tables B-l and B-3, respectively, Midyear Economic Report of the President, July 1950. Total Federal investment from Budget of the U. S. Government, 1950 table on p. 1113, items entitled "Additions to Federal Assets,'' (excludes "Major commodity inventories-net change," which is net increase in commodity inventories for the military stockpile and for agricultural price support) and "Expenditures for other developmental purposes." 92 |