| OCR Text |
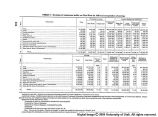
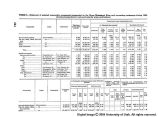
Show TABLE 2.-Summary and analysis of 15 major inland waterway through fiscal year 1948 projects for 20-year period, fiscal year 1929 Name of project Length, miles New work costs Maintenance and operation costs Total Federal costs Original project Existing project Total Unamor-tized at end of fiscal year 1948 Prior to fiscal year 1929 From fiscal year 1929 through fiscal year 1948 Total Lower Mississippi River __ 736 195 663 981 128 72 336 762 513 472 351 1,367 183 245 91 $0 1,495,000 49,694,000 17,657,000 5,421,000 0 551,000 9,847,000 826,000 657,000 674,000 4,627,000 542,000 185,000 4,295,000 $179,936,000 46,866,000 153,322,000 126,702,000 10,756,000 18,350,000 28,684,000 173,483,000 8,832,000 16,493,000 4,575,000 37,627,000 41,356,000 551,000 22,846,000 $179,936,000 48,361,000 203,016,000 144,359,000 16,177,000 18,350,000 29,235,000 183,330,000 9,658,000 17,150,000 5,249,000 42,254,000 41,898,000 736,000 27,141,000 $162,393,000 37,789,000 138,888,000 102,435,000 8,712,000 13,969,000 25,725,000 155,270,000 5,865,000 12,229,000 2,786,000 35,483,000 37,508,000 516,000 20,616,000 $25,204,000 15,193,000 7,516,000 25,506,000 14,631,000 2,447,000 982,000 2,822,000 1,969,000 5,648,000 2,156,000 33,367,000 360,000 2,121,000 3,541,000 $64,375,000 20,413,000 36,090,000 84,785,000 13,391,000 4,770,000 12,162,000 44,573,000 5,959,000 11,217,000 5,561,000 16,275,000 4,107,000 3,238,000 41,330,000 $89,579,000 35,606,000 43,606,000 110,291,000 28,022,000 7,217,000 13,144,000 47,395,000 7,928,000 16,865,000 7,717,000 19,642,000 4,467,000 5,359,000 7,674,000 $269,515,000 83,967,000 246,622,000 254,650,000 44,199,000 25,567,000 42,379,000 230,725,000 17,586,000 34,015,000 12,966,000 61,896,000 46,365,000 6,095,000 34,815,000 Middle Mississippi River Upper Mississippi River -______ ._ Ohio River__________ Monongahela River___ Allegheny River______ Illinois Waterway_____ Missouri River _____ Cumberland River____ Warrior River System.. Ouachita River......... Gulf Intracoastal Waterway Columbia River______ Sacramento River_____ Kanawha River______ Total............. 7,095 96,471,000 870,379,000 966,850,000 760,184,000 113,463,000 331,049,000 444,512,000 1,411,362,000 COMPARISON OF BENEFITS AND COSTS Name of project Average annual charges Charges, fiscal year 1948 Average annual traffic in thousands of ton-miles Average unit saving per ton-mile in mills Average annual savings Savings fiscal year 1948 Benefit-cost ratio Maintenance and operation Amortization and interest Total Period Fiscal year 1948 Lower Mississippi River____ Middle Mississippi River___ Upper Mississippi River__. Ohio River $3,219,000 1,021,000 1,805,000 4, 239,000 670,000 239,000 608,000 2,229,000 298,000 561,000 278,000 814,000 205,000 162,000 207,000 $4,167,000 955,000 3,433,000 4,043,000 339,000 471,000 702,000 4,293,000 236,000 388,000 118,000 539,000 725,000 8,000 529,000 $7,386,000 1,976,000 5,238,000 8,282,000 1,009,000 710,000 1,310,000 6,522,000 534,000 949,000 396,000 1,353,000 930,000 170,000 736,000 $13,455,000 2,560,000 8,295,000 10,235,000 1,344,000 871,000 2,128,000 11,456,000 899,000 1,271,000 315,000 4,068,000 2,005,000 154,000 1,026,000 14,370,792 i 536,825 i 871,612 »3,681,091 n,136,891 a 41, 512 i 882,722 1 41,428 i 86,852 » 319,082 a 20,670 *3,309,255 * 82,206 a 49,426 a 173,547 5.6 5.4 5.2 4.8 9.7 11.2 4.6 5.8 7.9 5.9 6.0 7.2 5.0 19.5 5.0 $24,635,000 2,887,000 4,569,000 17,488,000 10,984,000 466,000 4,054,000 242,000 683,000 1,894,000 123,000 23,851,000 412,000 965,000 876,000 $67,979,000 8,620,000 11,521,000 41,827,000 19,913,000 946,000 12,094,000 303,000 1,582,000 2,471,000 22,000 55,270,000 689,000 2,499,000 1,981,000 3.3 1.5 0.9 2.1 10.9 0.7 3.1 1.3 2.0 0.3 17.6 5.7 1.2 5.0 3.4 1.4 4.1 14.5 1.1 5.7 Monongahela River________ Allegheny River___________ Illinois Waterway______..... Missouri River___ . . _. Cumberland River........... Warrior River System........ Ouachita River 1.8 1.9 0.1 13.5 Gulf Intracoastal Waterway. Columbia River___________ Sacramento River.......____ Kanawha River 16.2 1.9 Total........ 16,555,000 20,946,000 37,501,000 60,082,000 94,129,000 227,717,000 114 years. J 20 years. 1 Projects now under construction, and present traffic is no indication of economic value of waterway. See project sheets. 412 years. 425 |


