OCR Text |
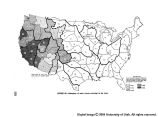
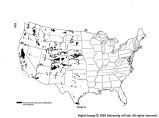
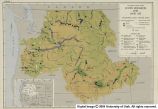
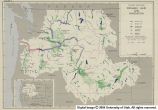
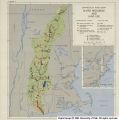
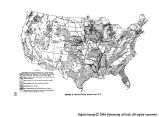
Show over large areas, and is well represented in the data now collected, except for isolated areas. Psychrometric data, likewise, are represented in the observations taken at the regular reporting stations of the Weather Bureau. Solar radiation, water temperature, soil and water temperature, and wind data are not yet adequate to meet the needs of analysts in the field of applied hydrology. To be of greatest value, these data must be collected from well located installations for a significant period of time. These data must then be processed and published currently. Only then is the facility serving its intended purposes. The longer the record for each installation, the more valuable it becomes. To meet deficiencies in the United States, there are required about 5,600 precipitation gages and 500 evapora- tion and other types of meteorological stations. These additional stations should be installed in order of priority in areas of greatest need within the next 10 years. This expansion should be accompanied by a corresponding expansion in facilities for processing and analyzing data collected. Climatic Maps Climatic maps have been used to show graphically the classification of climate in generalized terms or as empirical indexes. Average annual isohyetal and isother- mal maps of the country have been considered to be forms of climatic maps, but these have come to be regarded as inadequate for regional planning purposes. This is ac- counted for In the fact that climatological data are at present not in form to allow their presentation, either in the form of detailed summaries, or the presentation of the summaries in the form of maps. With the trend toward regional planning has come the necessity to consider more factors than areas of obvious water abundance or deficiency. The optimum utilization of water in areas ranging between these extremes con- stitutes the greatest opportunity for expansion in the future. These water appraisals must be based on some expression of dependability of precipitation, and considered in the light of the best use of water under soil and other con- ditions characteristic of these areas. Climatic maps, in common with other kinds of maps showing physical data, have the principal purposes of (1) presenting a comprehensive view of the regional climatological characteristics for which the map is in- tended, (2) providing the means of quick and accurate interpolation, and (3) the identification of areas in which specified climatic characteristics can be considered as homogeneous. For example, a regional planner, in con- sidering an agricultural program, may want to identify areas in terms of an average recurrence interval of, say, one year in seven, in which a certain crop or crop-group having the following specifications for water can be suc- cessfully established: * * * precipitation to exceed 14 inches in the months of April, May, and June, to be preceded by a 3-month accumulation of precipitation of not less than 7 inches and followed by 3 months in which the average monthly temperature does not exceed 87° F. A map showing lines of equal probability of the above- specified characteristics could be prepared quickly for almost any part of the country from existing data by the modern methods employing punch cards and machine techniques. Climatological data have been gathered at a progres- sively increasing number of points in the United States through the past 75 years. A total of over a billion items have now been collected. For the past 2 years the Weather Bureau has placed current observations on punched cards, and used machine methods to expedite publication of climatological summaries. However, until the "back-log" has been put onto punched cards, statisti- cal expression cannot be given to past observations, nor can the machine methods of summarization be applied. It is recommended that the Nation's climatological data be processed, utilizing available modern machine methods, and that climatic maps be prepared. Snow-Cover Data Snow surveys are conducted for the purpose of fore- casting the seasonal runoff that will be available for the benefit of such uses as irrigation; power generation; do- mestic, municipal, and industrial water supply; naviga- tion; and flood-control operations. Such surveys are carried out by obtaining representative samples, or cores, along established lines which are called "snow courses." Many Federal and State agencies and private organiza- tions collect and disseminate snow-cover data. The Soil Conservation Service coordinates the collection and dissemination of snow-survey data in the Western States. Figure 26 indicates the adequacy of snow course coverage in the West. There are many variables in the preparation of fore- casts for seasonal runoff, and therefore, an understanding of such variables increases the value of snow-cover data with the years of record. For planning purposes a long record is essential. Snow-course installations in Western States show a rapid increase in recent years as a result of increased use of water supplies. The following table indicates the rapid increase in installations in recent years, and by implication, the length of record for snow- course surveys. Number of western snow courses Year: installed and measured 1900______________________ 0 1910______________________ 3 1920______________________ 22 1930______________________ 130 1940______________________ 750 1950______________________ 1, 007 About 550 additional snow courses are needed to pro- vide an adequate network in the West. The New York Cooperative Snow Survey was formed in 1937 by a group representing 16 Federal, State, mu- nicipal, and private interests. In 1940 the work of the New York Cooperative Snow Survey was merged with that of the New England States to form the Eastern Snow Conference. The data collected are coordinated, printed, and distributed periodically during the winter and spring by several field offices of the Geological Survey. The in- formation on snow collected by the members of the Eastern Snow Conference is published annually by the Weather Bureau as "Snow Cover Surveys by Eastern Snow Con- ference." The 1940 publication indicated 246 stations in New York State and 176 in the New England States. 340 |