OCR Text |
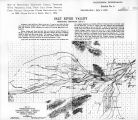
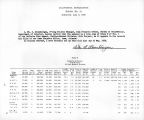
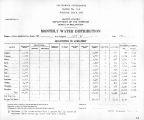
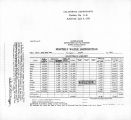
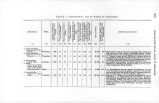
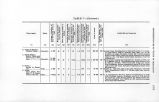
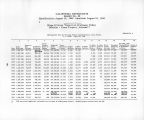
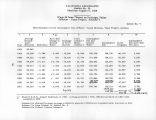
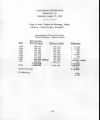
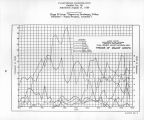
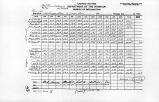
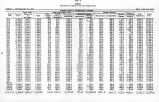
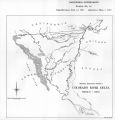
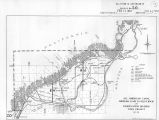
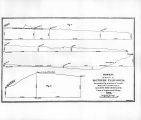
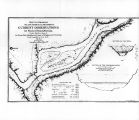
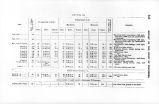
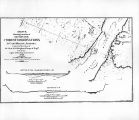
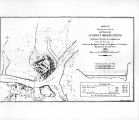
Show 340 REPORT OF THE CHIEF OF ENGINEERS. Wetted perimeter =p = 1116.7 feet. r = 4.144 feet. b = .713 foot. For the same reasons as at Stone's Ferry, but few subsurface-floats were observed, and the mean velocity has been computed from the mean surface velocity, as at that place, but here a correction was made, for wind. The results obtained are as follows : Force of wind =/= -f- 1.5. V = 250*.G4 fret, and Q ra = 11010.93 4- 12.5 = 11023.43 cubic feet per second : 12.5 cubic feet added represents the discharge through the channel not included in the section. The river fell 5.11 feet from July 9 to September 5, according to observations taken at Camp Mohave. During the interval between August 11, when current observation* were taken at Stone's Ferry, and September 3, when taken at Camp Mohave, the river at the latter place fell 1.84 feet. This will account for the greater portion of the difference between the discharge at Stone's Ferry and that at Camp Mohave, as a rise of 1.84 feet will cause a correspoud-ing increase of section at the latter place of over 2,000 square feet. A small portion is lost by evaporation, but a considerable quantity Hows below the bed of the river, in sections where the bottom is sandy, as at Camp Mobave. CURRENT OBSERVATIONS AT FORT VUMA, CAL. Here the conditions were more favorable. Two boats were obtained, one of which was used to pick up the subsnrface-floats after passing through the sections. The sections were also more regular than at the former places, and mid-depth floats could be sent out from all boat-positions without the annoyance of having them drag on the bottom at any poin t. The lloats were of the same character as those already described, except that no trail-line was used with the subsurface-floats. The observations were taken March 15 to March 20, 1*7G. The river was then at its lowest stage, and at a constant height (or nearly so) during the time of observation. The base-line was 3<><> feet long, measured along the right bank below the ferry. The following values were obtained: A = 2720.5 square feet, ") \V= 401.0 feet, n = 400.2 feet, } Fall per mile as determined by leveling = 1.21 feet. r= 5.848 feet, b = 0.0234 foot, J With the above values, and the formula for mid-depth velocities (formula (25) II and A),-we have : V = 2.^09 feet, and 2 = Va = 7058.74 cubic feet per second. The following table gives the number of floats from which the calculations were made, and the mean surface on mid-depth velocity in each division at the three places where observations were made : Mean division velocities. Division*. Remarks. Divisions. JN marks. The accompanying sketches and profiles show the location of the bases and tin1 topography iu the immediatu vicinity, as well as tho form aud area of the soctions. EVAPORATION. Experiments on tho amount of evaporation were made at Stone's Ferry and Camp Mohave. The vessel containing the water was placed in the river ho that it would retain the temperature of the river-water. Tho results were as follows : At Stone's Ferry several experiments, each one lasting from 2 to 3 days, showed the evaporation to be 0.23 inch per 24 hours. The atmosphere was dry aud either calm or stirred by gcntlo breezes; a few sand-storms of short duration occurred during the Stone s Ferry..... Camp Molmve____ Fort Y/tiiua........ Surface floats calm. Surface-float* wind op=1.3. Mid-depth lloats. No. of float x. XII. XIII. XIV. XV. XVI. XVII. XV11I. XIX. XX. XXI. XXII. Stone's Ferry...... Camp Moliave___¦ Fort Yuiua........ Surface-floats calm. Surface-floats wind-up=l-">. Mid-depth floats. Km. of floats. I. II. HI. IV. V. VI. VII. VIII. IX. X. XI. |