OCR Text |
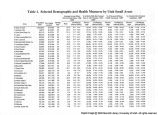
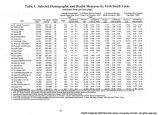
Show Table 1. Selected Demographic and Health Measures by Utah Small Areas (continued from previous page) Average Annual Motor % of Births With No Prenatal Vehicle Death Rate, 1992- Care in 1st Trimester, 1994-19962 1996" % of Persons Without Health Insurance, 19963 % of Adults Who Smoked Cigarettes, 19965 Population Per Capita Median n.i. Confidence Percen- Confidence Percen- Confidence Percen- Confidence Area Size1 Income1 Age1 Kate Interval (90%) tage Interval (95%) tage Interval (95%) tage Interval (95%) 34 W. Jordan, Copperton 28,860 $12,170 24 12.5 7 7 - 19 2 13.4% 12 0% - 15 0% 7.3% 2.3% - 12 4% 13.4% 4.2% - 22 5% 35 South Jordan 32^401 $13,936 24 8.3 3.9 - 15.5 11.0% 9.1% - 13.2% 8^1% 1.5% - 14.6% 0.1% 0.0% - 0.2% 36 Sandy Center 52,784 $14,260 27 12.7 8.9 - 16.4 12.7% 11.5% - 13.9% 20.0% 14.1% - 25.8% 6.1% 0.8% - 11.4% 37 Sandy, NE 28,948 $19,615 28 9.9 5.8 - 15.7 8.6% 7.0% - 10.5% 6.6% 0.0% - 14.0% 5.2% 0.0% - 10.8% 38 Sandy, SE 34,139 $19,391 25 11.1 7.0 - 16.9 10.4% 8.7% - 12.2% 5.9% 2.2% - 9.6% 7.1% 0.8% - 13.3% 39 Riverton/Draper 37,651 $12,542 27 16.4 11.1 - 21.7 13.1% 11.7% - 14.6% 8.1% 1.4% - 14.7% 1.5% 0.0% - 4.3% 40 Tooele Co. 30,371 $11,953 30 29.7 22.4 - 37.0 19.4% 17.5% - 21.4% 8.5% 7.1% - 10.0% 22.2% 19.7% - 24.7% 41 Lehi/Cedar Valley 14,951 $11,875 25 20.5 12.4 - 32.1 10.7% 9.0% - 12.6% 14.2% 7.2% - 21.1% 16.7% 6.9% - 26.5% 42 American Fork/Alpine 34,378 $12,285 24 12.1 7.9 - 17.8 12.2% 10.8% - 13.7% 3.5% 0.6% - 6.4% 0.8% 0.0% - 1.9% 43 Pleasant Grove/Lindon 26,294 $11,827 23 17.2 11.4 - 25.0 12.9% 11.4% - 14.5% 7.8% 2.7% - 13.0% 5.8% 1.0% - 10.6% 44 North Orem 35,107 $12,406 23 25.1 18.1 - 32.1 11.8% 10.8% - 13.0% 10.2% 6.3% - 14.1% 6.0% 1.0% - 11.0% 45 West Orem 27,114 $12,735 23 17.8 11.4 - 24.2 11.7% 10.5% - 13.0% 7.5% 3.5% - 11.5% 5.5% 0.5% - 10.4% 46 East Orem 30,579 $13,712 24 *** *** . **• *** "* - *•• 2.0% 0.0% - 5.6% 3.7% 0.0% - 8.5% 47 Provo/BYU 47,328 $12,581 22 7.1 4.6 - 9.7 10.0% 8.9% - 11.1% 9.8% 5.3% - 14.3% 3.2% 0.0% - 6.6% 48 Provo South 47,650 $9,795 24 10.7 7.5 - 13.9 11.2% 10.3% - 12.1% 8.6% 4.8% - 12.3% 7.4% 2.4% - 12.4% 49 Sprinqville/Spanish Fork 44,774 $12,283 25 20.8 15.6 - 25.9 9.0% 8.1% - 10.1% 11.1% 7.0% - 15.2% 9.5% 4.5% - 14.4% 50 Utah Co. South 19,920 $10,539 24 14.0 8.3 - 22.2 11.1% 9.4% - 12.9% 10.1% 5.2% - 15.0% 11.5% 4.1% - 18.9% 51 Summit Co. 25,301 $21,809 33 23.7 15.9 - 31.5 13.2% 11.2% - 15.4% 6.7% 5.5% - 7.8% 7.6% 6.0% - 9.2% 52 Wasatch Co. 12,441 $13,616 29 25.7 15.8 - 39.5 13.5% 11.1% - 16.4% 13.1% 11.8% - 14.4% 11.8% 10.2% - 13.4% 53 Tri-county LHD 39,334 $10,055 27 36.7 29.4 - 44.0 18.7% 17.0% - 20.5% 16.7% 14.8% - 18.5% 18.4% 16.0% - 20.8% 54 Juab/Millard/Sanpete Co. 39,473 $9,144 29 18.1 13.1 - 23.1 19.1% 17.4% - 20.9% 13.9% 11.8% - 15.9% 11.9% 9.4% . u.4% 55 Sevier/Piute/Wayne Co. 21,373 $10,126 32 14.9 9.3 - 22.6 21.6% 19.2% - 24.3% 15.5% 12.4% - 18.6% 15.3% 11.4% - 19.2% 56 Carbon/Emery Co. 31,108 $11,257 31 25.5 18.9 - 32.0 19.1% 17.1% - 21.3% 9.8% 8.0% - 11.5% 21.2% 18.1% - 24.3% 57 Grand/San Juan Co. 21,083 $9,333 29 49.3 38.0 - 60.7 29.7% 27.1% - 32.4% 16.5% 13.2% - 19.8% 13.6% 9.8% - 17.4% 58 St. George 51,395 $13,574 30 10.6 7.2 - 14.0 21.8% 20.1% - 23.5% 13.2% 10.0% - 16.3% 9.2% 5.8% - 12.5% 59 Other Washington Co. 26,263 $10,123 29 26.9 19.2 - 34.6 19.7% 17.9% - 21.7% 14.9% 11.3% - 18.5% 16.0% 11.3% - 20.7% 60 Cedar City 24,424 $11,485 25 17.9 11.5 - 24.3 11.0% 9.5% - 12.7% 12.7% 9.0% - 16.4% 5.4% 2.2% - 8.5% 61 Other Southwest Dist. 19.162 $10,571 34 33.7 24.1 - 43.4 22.6% 20.1% - 25.4% 24.3% 19.3% - 29.2% 19.2% 13.4% - 25.0% 1. 1997 population estimates. Age and per capita income figures are means, weighted by population count, of the ZIP code median values. Source: CACI Marketing Systems, Inc. La Jolla, CA. 2. Rate per 100,000 persons. Age-adjusted using the indirect method. Source: Utah Department of Health, Bureau of Vital Records. 3. Age-adjusted using the direct method. Source: Utah Department of Health, 1996 Utah Health Status Survey 4. Percentage of mothers delivering live births with no prenatal care in 1st trimester. Source: Utah Department of Health, Bureau of Vital Records 5. Percentage of adults (age 18+) who smoked cigarettes at the time of the survey. Age-adjusted, direct method. Source: Utah Dept. of Health, 1996 Utah Health Status Survey *** Sample size insufficient to produce population estimates. 29 |