OCR Text |
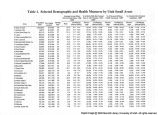
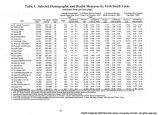
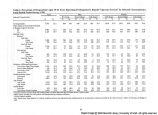
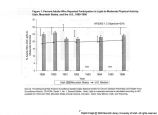
Show (1981) for proportions that are close to zero or one (less than or equal to 0.3 or greater than 0.7). Health insurance coverage and cigarette smoking data came from the 1996 Utah Health Status Survey (Bureau of Surveillance and Analysis, 1998). Health insurance was defined as "... private and employer plans, prepaid plans such as HMOs, and government plans, such as Medicare." A randomly-selected adult respondent reported information on each household member , including health insurance coverage, cigarette smoking, and ZIP code of residence. The data were age-adjusted because factors related to health insurance and smoking other than age were of primary interest. Age-adjustment and calculation of 95% confidence intervals were accomplished using SUDAAN (Shah, Barnwell & Bieler, 1997), which takes into account the design effects inherent in complex survey data (Lee, Forthoger & Lorimor, 1989). The data were then mapped using various geographic perspectives (mapping the entire state versus a close-up of a particular area) and mapping strategies (mapping rate categories of the measure, versus mapping whether a rate was significantly different from that for Utah overall). Due to space limitations, only one view was included here for each variable. Results Sixty-one small areas with an average 1997 population size of 33,500 persons (range 15,000 to 62,500 persons) were identified in Utah (see Table 1). Seventeen areas had population sizes of 40,000 or more, while in 38 areas the population sizes ranged between 20,000 to 40,000 persons. Due to local health district boundaries or input from local area residents population sizes were close to, but under 20,000 for six areas. Areas varied widely in surface area, with the smallest area consisting of a few square miles in an urban county, and the largest area encompassing four large frontier counties. In four cases, a small area encompassed an entire local health district. The largest urban health district, Salt Lake City/County Health District, included 23 small areas. A complete list of area definitions (ZIP codes and county combinations that were used to create each area) may be found in Table 2. Motor Vehicle Deaths During the five-year period from 1992 through 1996, the average annual motor vehicle death rate for Utah was 15.8 deaths per 100,000 persons. Rates in the small areas in Utah ranged from 3.9 deaths per 100,000 persons in the Foothill/U of U area (#19) to 49.3 in Grand/San Juan County (#57). The rates were mapped according to whether each was significantly different from (higher than, same as, or lower than) the overall state rate, based on whether its confidence interval included the overall Utah rate. The geographic pattern of results (Figure 1) indicated that motor vehicle death rates were higher for residents of more sparsely-populated areas. One might expect to find that pattern if residents of rural areas tend to drive longer distances at higher speeds in their day-to-day lives, but other explanations are possible. Note that five small areas (#1, 2, 18, 21, & 41) that had relatively small population sizes (Table 1) had death rates over 20 per 100,000, but were not considered "different" from the state rate because the confidence intervals for those rates were so large that they included the state rate. Prenatal Care Of all Utah mothers of live-born infants during the five year period from 1992 through 1996, 15.4% had not received prenatal care in the first trimester of pregnancy. The rates in small areas ranged from 8% in Farmington/Centerville (#14) to 35.7% in Glendale (#21) (Figure 2). To demonstrate a different approach to mapping health information, the prenatal care rates for small areas were ranked and assigned to five categories (quintiles). Of the 13 areas in the highest rate quintile (percentages of 19.4% or greater), six were in Salt Lake County. In five areas, over 25% of women had not received first trimester care; these included Downtown Ogden (#7), Rose Park (#17), Glendale (#21), South Salt Lake (#25), and Grand/San Juan County (#57). A scatter showing prenatal care rates and median per capita annual income of the 61 Utah small areas suggested that women were less likely to receive early prenatal care in areas with lower income levels (Pearsons's r = -.31, rj < .05) (Figure 3). Health Insurance At the time of the 1996 Utah Health Status Survey, 9.5% of Utahns were without health insurance. The small area with the highest percentage of uninsured persons, 24.3%, was Other Southwest District (#61). The lowest rate, 0%, was in the Avenues district in Salt Lake County (# 18) (Figure 4). That estimate is certain to be an artifact of the small Health Status Survey sample size in the Avenues area (n=77); the confidence interval in this case ranges from 0% to about 4%. The geographic pattern of results was striking, with primarily frontier areas in the 21 |