| OCR Text |
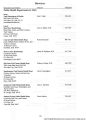
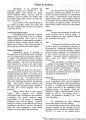
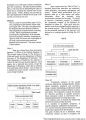
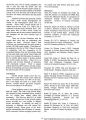
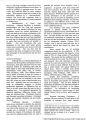
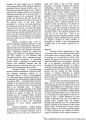
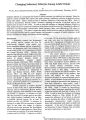
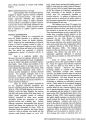
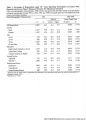
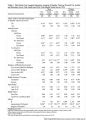
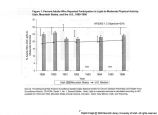
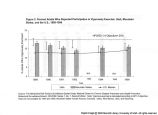
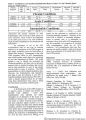
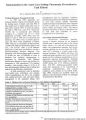
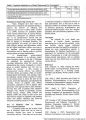
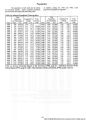
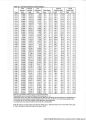
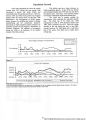
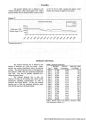
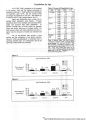
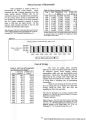
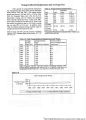
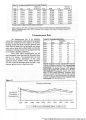
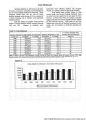
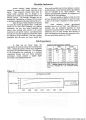
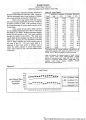
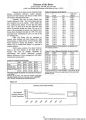
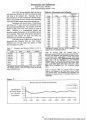
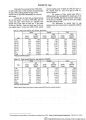
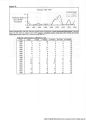
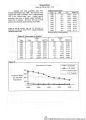
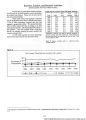
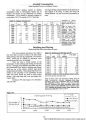
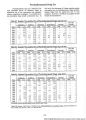
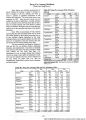
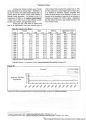
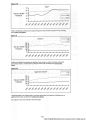
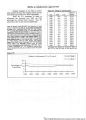
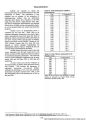
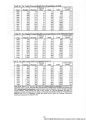
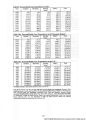
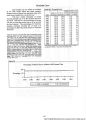
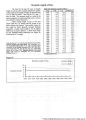
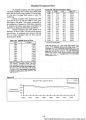
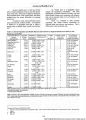
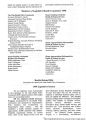
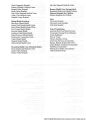
Show Suicide (ICD-9Code: E950-E959) (1995 Total Deaths in Utah - 298) Utah's age-adjusted death rates for suicide have been consistently higher than the national rate since 1979. The Utah:U.S. ratio shows Utah to be about 1.3 times higher on average than the national rate, and it has climbed to almost 1.5 times higher in 1991. However, the Mountain States have typically had higher suicide rates than the nation. Therefore, although Utah's rate is higher than the national rate, it is lower than the rate for the mountain states region for the years when data is available. The difference in the mortality rates between Utah males and females is dramatic. For the ten-year period ending in 1990, rates for males and females remained fairly constant, while males were almost four times as likely to die from suicide. The 1991-1993 period, however, showed an increase in male deaths and a decrease in female deaths. The Utah male to female ratio increased to almost five to one. Table. 50. Sources: Utah 1982-1994: Utah Department of Health, Division of Community Health Services. Action 2000. Utah 1980-1992: Utah Department of Health, Division of Community Health. Unpublished report. Utah 1970 and 1979: Utah Department of Health, Bureau of Vital Records and Health Statistics. Unpublished report. U.S. 1979-1992: National Center for Health Statistics. Monthly Vital Statistics Report. 33(6); 34(6); 35(6); 36(5); 32(6); 39(7); 40(8); 41.(7); 42(2); 43(6S). Public Health Service, Washington, D.C.: U.S. Government Printing Office. U.S. 1970: United States Bureau of the Census. (1992). Statistical Abstract of the United States: 1992 (112th ed.). Washington, DC: U.S. Government Printing Office, p. 81. Table. 51 Sources: 1982-1994: Utah Department of Health, Division of Community Health Services. Action 2000. 1979-1990: Utah Department of Health, Bureau of Vital Records and Health Statistics. Unpublished report. Salt Lake City. Figure 30______________________________ Table 50. Suicide Rates Utah:U.S. Year Utah U.S. (Ratio) 1970 16.4 11.8 1.39:1 1979 14.5 11.7 1.24:1 1980 14.6 11.4 1.28:1 1981 14.7 11.5 1.28:1 1982 14.3 11.6 1.23:1 1983 14.6 11.4 1.28:1 1984 15.3 11.6 1.32:1 1985 14.2 11.5 1.23:1 1986 15.9 11.9 1.34:1 1987 15.3 11.7 1.31:1 1988 14.8 11.4 1.30:1 1989 13.4 11.3 1.19:1 1990 16.4 11.5 1.43:1 1991 16.9 11.4 1.48:1 1992 15.3 11.1 1.38:1 1993 15.2 11.3 1.35:1 1994 15.7 11.2 1.40:1 1995 15.2 11.0 1.38:1 * Age-adjusted rates per 100,000 population. Rates age-adjusted to the 1940 standard population. Table 51. Suicide Mortality by Sex in Utah* Years1 Total Male Female 1979-81 14.5 23.2 6.3 1982-84 14.8 24.1 5.9 1985-87 15.1 24.4 6.3 1988-90 14.8 24.1 6.1 1991-93 15.8 26.5 5.4 1994 15.7 25.9 5.9 1995 15.2 24.8 5.8 Note: from 1979 to 1993 the Utah numbers represent a three-year average because of the small number of deaths per year. Suicide 20 j Age-adjusted 15 --Mortality per 100,000 Population 5 0 •Utah U.S. 10 -- 1970 1980 1982 1984 1986 1988 1990 1992 1994 99 |