OCR Text |
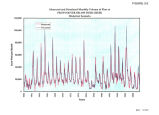
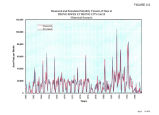
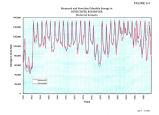
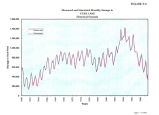
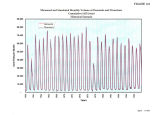
Show Final Report Hydrologic Model Analysis of the Provo River Basin The User's Manual documents the variable names and common error messages. The document also includes a quick guide to running the model, with a description of hardware and software requirements, installation procedures, and model terminology. Operation of the graphical interface is explained as well. 2.6.3 Model Calibration PROSIM was calibrated by simulating historical conditions on the Provo River system. The objective of the calibration was to make minor adjustments to the input data as necessary, and to verify the accuracy of the model for use in simulating future conditions on the river. The calibration process involved the following steps: • Select separate calibration and verification periods for the model. • Develop model input data. • Perform initial simulations for the calibration period and compare with historical data. • Adjust model input data for the entire period of hydrological record. • Repeat until good agreement is achieved between model output and actual observed conditions during the calibration period. • Run calibrated model for the verification period and compare with actual conditions to evaluate the calibration accuracy. Separate calibration ( 1960 to 1970) and verification ( 1971- 1984) periods were selected to calibrate the model and to demonstrate the accuracy of the model calibration. These periods were selected because reasonably accurate diversion and reservoir storage data were available, and because they did not include any major operational or facility changes. The results of the calibration process were related to the accuracy of simulated flows, reservoir contents, and river diversions. Each of these is discussed below. Simulated Provo River flows were compared with historically recorded flows at the streamgages at Woodland, at Hailstone, above Deer Creek, below Deer Creek, and at Provo City. All simulated average annual flows were within one or two percent of the recorded values. Individual annual flows were within four percent at Woodland, Hailstone, and above Deer Creek. Annual flows were within five to seven percent below Deer Creek. Simulated annual flows at Provo City were within January 1998 Page 20 |