| OCR Text |
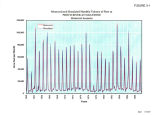
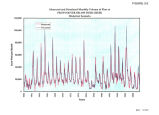
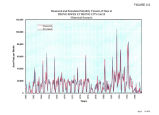
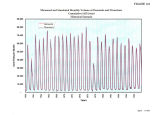
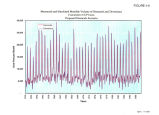
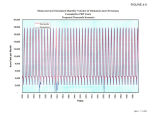
Show Final Report Hydrologic Model Analysis of the Provo River Basin 4.4 Water Supply and Transbasin Diversion Results Simulated water supply and transbasin diversion results under the Proposed Demands Scenario appear reasonable and consistent with expectations. Key results are tabulated below. Table 4- 6 Key Simulated Average Annual Diversion Results in Acre- Feet Proposed Demands Scenario Diversion or Water User Demand Diversion Maximum Shortage Comments Weber- Provo Canal N/ A 59,500 N/ A Duchesne Tunnel N/ A 33,200 N/ A Wasatch Division Direct Flow Rights ( lumped) 98,600 95,500 12,000 Includes some demands that exceed rights. The total of water rights limited by demand equals 96,000 acre- ft/ year. Central Utah Project 107,500 107,500 0 Provo River Project 100,000 96,600 68,500 Provo Division Direct Flow Rights ( lumped) 44,400 38,600 20,100 Includes some demands that exceed rights. The total of water rights limited by demand equals 38,800 acre- ft/ year. Utah Lake Users 196,700 196,700 0 Strawberry- Utah Lake N/ A 28,600 N/ A PRP and CUP demands and simulated diversions are compared in Figures 4- 8 and 4- 9. The shortages shown on Table 4- 6 for Heber Valley and Provo Division direct flow water users are due primarily to historical demands that exceeded users7 rights. Other simulated diversions closely match user demands. 4.5 Conclusions Regarding the Proposed Demands Scenario Simulation The PROSIM simulation of the Provo River system under historical hydrological and proposed demands and operating conditions has provided useful information on future Provo River water resources conditions. However, the simulated results are only as good as the assumptions used in developing the model and the scenario. If a different set of demands were applied, or a different priority was used for a critical water rights assumption, the simulated results might have been significantly January 1998 Page 31 |


