| OCR Text |
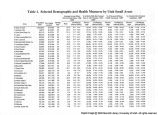
Show Table 1. Selected Demographic and Health Measures by Utah Small Areas Average Annual Motor % of Births With No Prenatal % of Persons Without % of Adults Who Smoked Vehicle Death Rate, 1992- Care in 1st Trimester, 1994- Health Insurance, 19963 Cigarettes, 1996s 1 I9962 19964 Population Per Capita Median Confidence Percen- Confidence Percen- Confidence Percen- Confidence Area Size1 Income1 Age1 Rate Interval (90%) tage Interval (95%) tage Interval (95%) tage Interval (95%) 0 State of Utah 2,042,003 $14,045 28 15.8 15.1 - 16.4 15.4% 15.2% - 15.6% 9.5% 8.5% - 10.6% 12.3% 11.4% - 13.1% 1 Briqham City 18,915 $14,867 30 20.3 13.3 - 29.8 14.7% 12.6% - 17.0% 9.6% 5.7%- 13.5% 9.7% 5.2% - 14.1% 2 Other Box Elder Co. 20,712 $13,231 27 21.3 13.7- 29.0 17.1% 14.9% - 19.5% 3.8% 1.7% - 5.9% 13.0% 8.0%- 18.1% 3 Loqan 60,515 $13,006 24 7.7 5.1 - 10.3 8.6% 7.7%- 9.6% 9.2% 7.1%- 11.3% 4.8% 2.8% - 6.8% 4 Other Cache/Rich Co. 26,325 $11,769 26 25.0 17.6 - 32.4 10.6% 9.3% - 12.1% 6.2% 4.0% - 8.4% 7.2% 4.0% - 10.3% 5 Ben Lomond 39,592 $13,151 30 18.2 13.2 - 23.2 16.2% 14.7% -17.8% 12.1% 8.2% - 15.9% 18.7% 12.9% - 24.4% 6 Morqan/East Weber Co. 32,686 $14,757 28 9.4 5.7 - 14.7 11.0% 9.4% - 12.9% 5.6% 2.7%-8.5% 9.6% 4.9% - 14.4% 7 Downtown Oqden 24,663 $12,484 31 16.8 11.1 -22.6 28.4% 26.4% - 30.4% 19.6% 13.6%- 25.7% 28.2% 20.7% -35.7% 8 South Oqden 30,696 $18,185 33 11.9 7.9 - 17.3 16.7% 15.1% - 18.4% 7.2% 3.6% - 10.8% 9.4% 5.1%- 13.7% 9 Roy/Hooper 36,276 $14,404 28 17.2 11.9-22.4 11.2% 9.9%- 12.7% 9.3% 5.8% - 12.8% 16.4% 10.8%- 22.0% 10Riverdale 23,783 $15,443 31 13.0 8.2 - 19.8 13.2% 11.4%- 15.2% 1.2% 0.0% - 2.8% 12.4% 6.0% - 18.8% 11 Clearfield/Hill AFB 45,593 $11,592 24 11.2 7.5 - 14.9 15.4% 14.0% - 16.8% 6.1% 3.5%-8.7% 15.5% 10.3% - 20.8% 12 Layton 53,648 $14,465 26 15.9 11.7 - 20.0 14.5% 13.3% - 15.7% 4.9% 2.6% - 7.2% 14.0% 9.2% - 18.7% 13 Syracuse/Kaysville 29,312 $14,029 25 13.7 8.9 - 20.4 13.3% 11.7%- 15.1% 3.2% 1.0% - 5.4% 8.5% 4.3% - 12.8% 14 Farminqton/Centerville 24,991 $14,948 24 6.2 2.9- 11.6 8.0% 6.6% - 9.7% 3.4% 0.9% - 5.8% 2.9% 0.1%-5.7% 15 Woods Cross/No SL 17,596 $13,972 25 18.5 11.4 - 28.5 11.0% 9.2% - 13.2% 6.1% 1.8% - 10.5% 8.3% 2.2% - 14.4% 16 Bountiful 44,309 $17,141 30 9.1 5.9 - 12.4 9.4% 8.3%- 10.7% 5.1% 2.6% - 7.6% 8.8% 4.5% - 13.0% 17 Rose Park 26,083 $12,871 30 22.1 15.3 - 28.8 31.2% 29.1% -33.3% 19.3% 10.6% - 28.0% 23.6% 11.0%- 36.2% 18 Avenues 23,277 $23,110 35 11.1 6.8- 17.0 19.3% 17.1%-21.8% 0.0% 0.0% - 0.0% 6.3% 0.0% - 12.9% 19 FoothiU/U of U 22,917 $23,761 35 3.9 1.5 - 8.2 9.7% 8.2%- 11.4% 2.8% 0.0% - 5.8% 6.1% 0.3% - 11.9% 20 Maqna 20,128 $11,315 25 10.9 5.9 - 18.4 18.8% 16.7% -21.0% 6.7% 0.4% - 13.0% 34.8% 21.6%- 48.1% 21 Glendale 20,579 $11,133 32 22.2 14.8-29.7 35.7% 33.4% - 38.0% 20.0% 11.0%- 29.0% 22.3% 11.1%-33.5% 22 West Valley I 58,179 $11,989 25 14.4 10.6 - 18.3 19.3% 18.0% - 20.6% 8.2% 4.3%- 12.1% 21.9% 14.7%- 29.0% 23 West Valley II 40,174 $12,773 27 16.9 12.2 - 21.7 19.8% 18.3% - 21.4% 20.7% 12.9% - 28.5% 21.3% 12.3% - 30.2% 24 Downtown Salt Lake 48,215 $16,691 33 16.3 12.4 - 20.2 20.7% 19.2% - 22.2% 18.0% 11.5%- 24.5% 19.0% 12.6% - 25.4% 25 South Salt Lake 22,416 $12,582 31 24.5 17.2-31.7 25.9% 23.9% - 28.0% 17.2% 8.3%- 26.1% 34.0% 19.4% -48.7% 26 Millcreek 55.943 $18,385 36 12.7 9.4- 16.1 13.0% 11.9%- 14.3% 4.7% 1.3% - 8.0% 9.9% 3.8% - 16.0% 27 Holladay 46,584 $21,967 37 11.3 7.8 - 14.8 12.0% 10.7% - 13.6% 5.0% 1.5% - 8.4% 8.4% 3.2% - 13.5% 28 Cottonwood 45,933 $20,675 33 13.8 9.7- 17.9 11.4% 9.9% - 13.0% 7.4% 2.5% - 12.3% 7.6% 2.3% - 12.9% 29 Kearns 62,462 $12,057 25 17.1 13.0- 21.2 18.0% 16.8% - 19.2% 8.4% 4.7%- 12.1% 20.6% 13.5% - 27.8% 30 Taylorsville 33.294 $15,877 29 14.7 9.8- 19.7 16.3% 14.7%- 18.1% 12.8% 7.0% - 18.6% 14.5% 5.2% - 23.8% 31 Murray 30.139 $17,764 33 11.9 7.8 - 17.5 15.3% 13.7%- 17.1% 14.8% 7.6% - 22.0% 18.5% 8.5% - 28.5% 32 Midvale 27.154 $14,959 29 9.4 5.5 - 14.9 20.1% 18.2% - 22.0% 4.3% 0.0% - 9.0% 12.6% 3.6% - 21.6% 33 West Jordan No. 44,308 $12,100 22 11.9 7.7- 16.1 13.1% 11.9%- 14.5% 16.2% 11.3%- 21.1% 11.9% 5.3% - 18.5% |


