OCR Text |
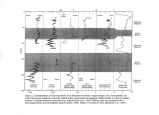
Show WATER DENSITY VERSUS LAKE ELEVATION The graphs show average yearly lake elevation ( feet above mean sea level) and water density ( g/ cm ), a measure of salinity or salt content, for the south ( site AS2) and north ( site LVG4) arms of the lake from 1984 through 1996 ( see map). The density of the south arm, which is fed by fresh- water tributaries, varies inversely with lake elevation. The north arm, which is fed by salty south- arm water, is more saline and less influenced by lake level. Farmington and Bear River Bays are much less saline than either the north or south arms of the lake. UGS BRINE- SAMPLING PROGRAM SITE AS2, SOUTH ARM, 1966- 1996 i i i i I i 1965 1970 i i i i i i i i i i i i 1975 1980 1985 YEAR I I I I I i I l I I I 1990 1995 2000 i i i i l i i 1965 1970 i i i i l i i i M i i 1975 1980 1985 YEAR ITT 1995 2000. - 4215 = r j4210 > 4205 3 ^ 4200 ^ 4195 = 4190 UGS BRINE- SAMPLING PROGRAM SITE LVG4, NORTH ARM, 1966- 1996 1965 1970 1975 1980 1985 YEAR 1990 1995 2000 i i i n 1965 1970 i i l i i i i l i i i i l i i i i I i i i i l i i i i 1975 1980 1985 1990 1995 2000 YEAR WATER CHEMISTRY Water chemistry, or the relative abundance of dissolved ions ( dry- weight basis), remains relatively constant throughout both arms of the lake. Table I shows the composition of dissolved salts in Great Salt Lake compared with the ocean ( average composition), the Dead Sea, and Sevier Lake ( Millard County, Utah). Table 1. Comparison of different water chemistries ION GREAT SALT LAKE OCEAN DEAD SEA SEVIER LAKE UTAH Sodium 32.1 30.8 12.3 35.5 Potassium 2.3 1.1 2.3 1.4 Magnesium 3.7 3.7 12.8 1.6 Calcium 0.3 1.2 5.2 0.2 Chloride 54.0 55.5 67.1 49.1 Sulfate 7.6 7.7 0.1 12.1 MINERAL- EXTRACTION INDUSTRIES Six mineral- extraction industries currently operate on Great Salt Lake ( table 2). Cumulatively, these industries produced nearly 2.8 million tons of products during 1995, valued at about $ 300 million. Table 2. Active mineral extraction industries INDUSTRY PRODUCT( S) Magnesium Corporation of America ( MAGCORP) Primary magnesium metal, alloys, and chlorine gas AKZO Salt Company Sodium chloride products Morton Salt Company Sodium chloride products Great Salt Lake Minerals Corporation ( GSLM) Potassium sulfate ( fertilizer), magnesium chloride products North American Salt Company Sodium chloride products North Shore Ltd. Partnership/ Mineral Resources International Concentrated brines/ processed into dietary supplements SALT LOAD AND POTENTIAL RESOURCES Great Salt Lake contains about 4.5 billion tons of salt. Major changes in lake conditions, such as the 1980s flooding, breaching the Southern Pacific Railroad ( SPRR) causeway in 1984, and West Desert pumping in 1987, have altered the balance of salt between the two arms. Raising the SPRR causeway during the 1980s reduced the permeability of the causeway and the bidirectional transfer of brines between the southern and northern arms. Because of this, there has been a constant loss of salt from the south arm of the lake to the north arm since 1994. The reduction in salinity is of great concern to the south- arm mineral- extraction industries and to the lake's multi- million dollar brine shrimp industry. A buried, wedge- shaped body of natural sodium sulfate ( mira- bilite) extends westward from Promontory Point, beneath the SPRR causeway. Sodium sulfate is found cementing the near- shore sediments at shallow depths at numerous locations around the perimeter of the lake. |