OCR Text |
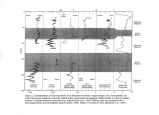
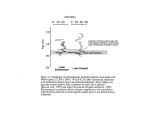
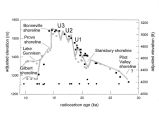
Show elevated polar temperatures ( Webb and Harwood, 1991; Funder et a/., 1985) and eustatic sea levels about 35 m higher than today ( Krantz, 1991). The 2.6 Ma event is shown as a pronounced ( 2 ° C) cooling event. Thereafter, temperature gradually declines, and precipitation increases until 0.75 Ka, when overall ( average of glacial+ interglacial) temperature drops 3 ° C and precipitation increases by 100 mm. The uppermost samples provide temperature estimates ( 10.8 ° C, vs. mod. 10 - 11 ° C) and precipitation ( 310 mm, vs. mod. 300 - 400 mm) near contemporary values ( Fig. 2). During the Early Pleistocene ( 2.6 - 0.75 Ma), shallow lakes and marshes persisted in the northern basin of Great Salt Lake. Beginning 0.75 Ma, the percentages of wetland plants and algae decline ( Fig. 1), and fluctuations of glacial indicators ( Abies + Picea + Pseudotsuga) vs. Interglacial indicators ( Cupressaceae + Ambrosia + Sarcobatus) begin. The high percentages of the interglacial indicators coincide with odd stages of the marine isotope chronology, and high percentages of the glacial indicators match the even stages. Algae and the pollen of wetland plants are rare during interpluvials when the lake is shallow and saline, and during pluvials when littoral vegetation is far from the core site. They are most abundant during intermediate lake levels between pluvials and interpluvials. This relationship implies primary climatic control of lake cycles over the last 0.75 Ma. This palynological relationship to pluvials and interpluvials can be used to produce an index of water- depth ( Fig. 3). Six pluvial - interpluvial cycles follow deposition of Lava Creek " B" ash, with an average length of ca. 100 Ka. The amplitudes of the oscillations increase through time, with water- depth minima becoming lower and maxima becoming greater. The Indian Cove diagram shows a dramatic increase in total pollen concentration ( from 6000 to 30,000 grains cm3) at ca. 310 Ka. The concentration remains high up to the uppermost samples collected, and represent a fundamental change in the ( D o 2- 4 I o i o i CD 1 o 1 o 1 o "-• J O 1 O 1 o 1 o 1 CD 1 CD I CD I o in o LO o LO o LO O LO o LO CD LO CD i- « - CNI OJ ro f-> * 5t- "<*• LO LO CO CO I"-* Age ( Ka) Figure 3. Water depth reconstructed from pollen and algae ( arbitrary units). |