| OCR Text |
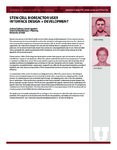
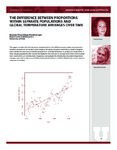
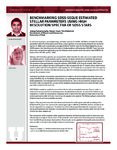
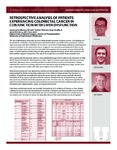
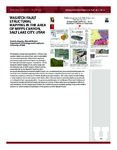
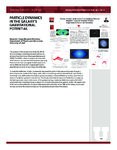
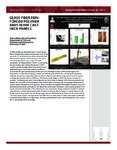
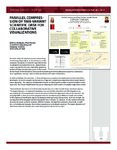
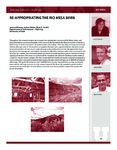
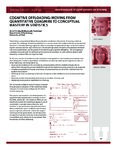
Show 175 THE UNIVERSITY OF UTAH RESEARCH POSTERS ON THE HILL 2012 PARALLEL COMPRES SION OF TIME VARIANT SCIENTIFIC DATA FOR COLLABORATIVE VISUALIZATIONS Kathryn Rodgers, (Paul Rosen) Scienti c Computing and Imaging Institute University of Utah Research within the physical sciences is becoming increasingly dependent on visual simulations to display results and analyze experiments. However, the size of the data set required to render these visualizations can limit researchers' abilities to share results or collaborate with distant peers. Many scientific simulations require the power of super computers. However, often these super computers are located in a remote location, making it difficult to transfer data and results. This problem can be alleviated by making the data easier to handle by compressing it so the data files are not quite as large. However, this introduces a new problem - speed. Compressing large data files can take anywhere from several minutes to several days. This can be a major roadblock during the development of a research study. My research focuses on creating parallel algorithms to quickly compress these data sets into manageable sizes so that they can be transferred more easily. The work is based on parallelizing existing compression algorithms specific to time-variant scientific data that uses a series of points' paths to render an image. These methods include a Trajectory Simplification method and a Cluster Simplification method. These methods have been recreated as parallel algorithms so that they run as much as seven times faster than the originals. The parallel algorithms take advantage of performing multiple steps of the compression process at the same time. Parallel Compression of Time-Variant Scientific Data for Collaborative Visualizations Kathryn Rodgers and Paul Rosen Scientific Computing and Imaging Institute Student Photo Faculty Photo Trajectory Simplification Trajectory Simplification Speed Ups Results of Compression [1] Abstract Clustering Simplification Speed Ups Kathryn Rodgers Paul Rosen Methods Clustering Simplification Results Basic Algorithm 1) Given a file containing multiple sets of points that make up paths 2) Create a new line using only the first point and the last point in the original path 3) Find the point in the path that is furthest from this new line and include it in the line 4) Repeat Step 2 and Step 3 until either a certain number of points are included or every point not included is less than some error away 5) Repeat Step 4 until all of the paths have been processed Basic Algorithm 1) Given a data set of multiple paths 2) Pick two paths to be the base path for the first clusters 3) Add every other path to the cluster whose base path is most similar 4) Split up the clusters by repeating steps 2 and 3, creating new clusters 5) Split clusters until every cluster has at the most a certain number of paths or until every path in a cluster is within a certain error range All-in-Parallel Method 1) Read in the first chunk of paths 2) Begin processing these paths as described. While these are processing, another thread begins to read in the next chunk of paths. 3) When processing is done, one thread writes the results, one thread reads another chunk, and the rest begin processing again Processing -in-Parallel Method 1) Read in all of the data 2) Begin N threads to process N paths simultaneously 3) Each thread creates its own simplified path 4) Write the results to a file Parallel Algorithm 1) Read in the data 2) Create initial clusters 3) Split the cluster with the greatest error using multiple threads to perform the calculations 4) Repeat Step 3 5) Stop diving clusters when the clusters either have a certain number of members, or all members in the cluster are within a certain error range [1] Paul Rosen and Voicu Popescu. Simplification of node position data for interactive visualization of dynamic datasets. IEEE Transactions on Visualization and Computer Graphics, 99(PrePrints), 2011. * Tests run on Linux supercomputer with (264) 2.66GHz cores and 2.8TB RAM 0 2 4 6 8 10 12 2 3 4 5 6 7 8 9 10 Speed Up Number of Threads Before Compression Processing in Parallel Speed Up After Compression Compression Ratios using Trajectory Simplification (ITS) and Trajectory Clustering (TC) 0 2 4 6 8 10 12 2 4 6 8 10 Speed Up Number of Threads All in Parallel Speed Up 27,000 KB Data Set 663,000 KB Data Set 4,400,000 KB Data Set Perfect Scaling 0 1 2 3 4 5 6 0 2 4 6 8 10 12 Speed Up Number of Threads Clustering Simplification Speed Up 27,000 KB Data Set 663,000 KB Data Set 4,400,000 KB Data Set Research within the physical sciences is becoming increasingly dependent on the ability to create computer simulations of scienti c experiments and visualizations to analyze the results. Many of these visual representations are created by graphing millions of time-varying data points to the screen for the length of the simulation. Storing and transmitting all of these data points powerful communica-tions capabilities, making it hard to share simulations with other collaborators. In order to facilitate the movement of these visualizations, a number of compression schemes have been developed. So far, the research has focused on a Trajectory Simpli cation algorithm and a Cluster Simpli - cation algorithm. The Trajectory Simpli cation focuses on reducing the number of points included in each trajectory. The Cluster Simpli cation focuses on reducing the total number of complete trajectories stored. These methods have been successful in reducing the amount of data transfer that a simulation requires. The largest data set, a whopping 9.4 gigabytes, was successfully reduced to only 200 megabytes, ap-proximately 2% of its original size. Even so, the amount of time the algorithms take can be extensive. By using OpenMP to allow parts of the program to be run simultaneously in di erent threads, the runtime of the Trajectory Simpli cation algorithm displays promising strong scaling results. With two threads, the running time of the program has been decreased from 4 minutes to 2 minutes. As the number of threads increase, the speed up factor increases. With ten threads, the algorithm only takes 20 seconds. In addi-tion, as the data size increases, the runtimes experience a more drastic speed up. The largest data set ran 7 times faster when ten threads were used, dropping from 36 minutes to only 5. |