| OCR Text |
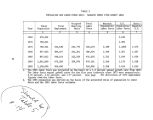
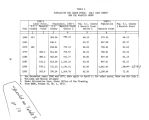
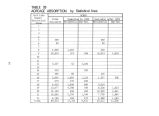
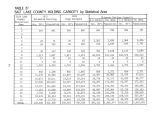
Show Thus, even though great housing increases may take place in Sandy, there is no assurance that these levels will maintain themselves and not shift to other communities. The factors influencing these shifts are discussed below. Growth Patterns 1970- 1975 As illustrated in Figure 3, the most building activity since 1970 has taken place in the southeastern and southwestern parts of Salt Lake Valley. Sandy showed the highest growth rate with West Jordan and Taylorsville- Bennion following closely. This is a change from the 1965- 1970 period when growth was concentrated in Granger- Hunter, Murray and the eastern part of the Big Cottonwood Planning District. These facts are not surprising but illustrate how the focus of intensity moves through time. The factors responsible for the high level of building activity in the southern part of the County today are: • relatively low land values • availability of large land parcels • availability of utilities The rapid growth in the southern portion of the County will introduce new factors, which when combined with outside economic forces, may put a " brake" on this development. These factors are summed as follows: • As subdividing takes place, the speculative value of the land in the vicinity increases. This is already evident in the southern area. For example, land in Riverton has risen recently from about $ 2,000 per acre to between $ 5,000 and $ 10,000 per acre. • As land parcels are reduced in size, the overall cost to the buyer increases and it becomes more and more difficult to assemble large parcels which can be economically developed. 40 |


