| OCR Text |
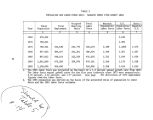
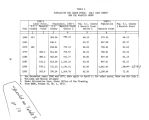
Show Comparing the Salt Lake County figures with those for the total of the five Wasatch Front counties and accepting the premises of Alternative Zero, ' we observe that the general downward trend for Salt Lake County's share of the Wasatch Front's population from 1960 to 1970 ( with an interruption in 1975) continues to 1980, after which time it appears that Salt Lake County " takes off" relative to the other four counties, indeed, increasing its share by over seven percent in the 15 years from 1980 to 1995. We must ask first if the comparison of the Series C- DF projection for Salt Lake County, with the Alternative Zero projection for the multi- county district ( MCD) makes sense. The revised Series C- DF projection yields a " substantial increase in the proportion of area population assumed to reside in Davis County, a slight decrease in Salt Lake and Weber Counties and a large relative, but small absolute, increase in Morgan County."^ ' In the revised projection, constant fertility rates were assumed for Morgan and Davis Counties. From the assumptions of Series C- DF alone, clearly, one would not expect the " take off" of Salt Lake County's proportion of the MCD population. Part of the disparity could be in the " neutrality" of the Alternative Zero projection with regard to development in the State as a whole, particularly with regard to energy development. Thus, our MCD population figure could be somewhat on the low side, should some of the major development events occur from among those listed in Volume 1 of " The Utah Process Alternative Futures." Even if the MCD population should be somewhat on the low side, since Salt Lake County is the largest of the five counties in that group ( the Wasatch Front), the rather unusual change in percent from 1980 to 1995 appears questionable. Thus, from inspection of the percentage figures in column 5 of Table 3, a rate of 70 percent would appear more reasonable, yielding a Salt Lake County figure of 775,000. The Williams and Mocine present view of the projection for 1995 therefore, is that the 790,000 population figure is the upper limit of a range, the lower figure of which is 775,000. This view is strengthened on 11 |


