| OCR Text |
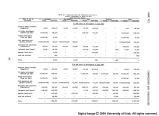
Show PART VII COMPARISONS AND CONCLUSIONS On-site water depletions Four projected levels of depletion for alternative resource develop- ment are shown in Table 21. The present base of 1965 is used as a refer- ence for projections. Data in Table 21 compares the on-site depletions of the four projected levels of development for the year 1965 and for the year 2020. Depletions are shown by type of use, states, and subregions. Depletions are estimated to nearly double from the present 1965 level to the level of the framework plan in 2020 and states' alternative at the 6.55 million acre-foot level. Irrigation depletions and export, which will ac- count for about 75 percent of total depletions, will each increase about a million acre-feet. Thermal-electric power uses will have the greatest per- cent of increase-at the 8.16 MAF level of development about 3,000 percent. Water for mineral uses will increase significantly with oil shale de- velopment being included in the three "states1 alternatives." For compar- ative purposes the alternative at 6. 55 MAF was defined by the states at the same total depletion level in 2020 as the framework plan. Departure from the framework plan due to states' adjustment in types of use is shown in Table 22. Two additional states' alternatives for greater depletion levels were then defined. Departure from the framework plan due to states' adjustment in type of use for the 8.16 MAF level of depletion is shown in Table 22. Agricultural activity Agriculture in this region is tied to irrigated cropland production. Therefore, the increase in production on existing irrigated lands and the development of new irrigated land relates to a large portion of the agri- cultural activity. (See Table 23.) Projected irrigated acreage for the alternative levels of development by time frame is as follows: Level of development Irrigated acreage (thousand acres) 1965 1980 2000 2O20 1,622 1,732 1,878 2,O2^ 1,622 1,499 1,529 1,551 1,622 1,79^ 1,95^ 2,122 1,622 1,792 2,102 2,118 1,622 1,872 2,22^ 2,35^ 1,622 1,872 2,259 2,579 On-going program 1968 OBERS Regionally interpreted OBERS States' alternative (6.55 MAF) States' alternative (8.16 MAF) States' alternative (water available) The on-going program is based on installation of authorized Fedexal projects and development of new irrigated land by private interests. About 70 to 80 percent of the present lands having short water supply 95 |


