| OCR Text |
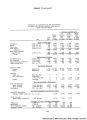
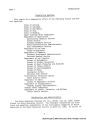
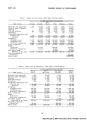
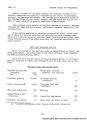
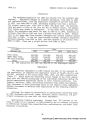
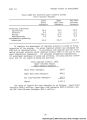
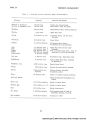
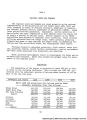
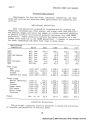
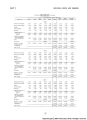
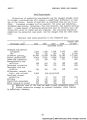
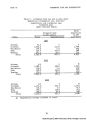
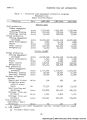
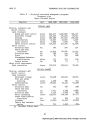
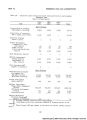
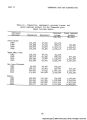
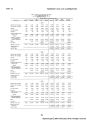
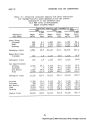
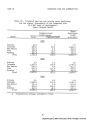
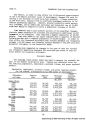
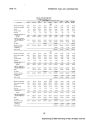
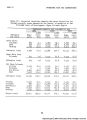
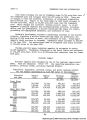
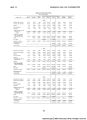
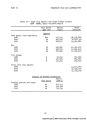
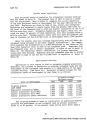
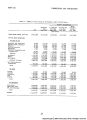
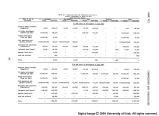
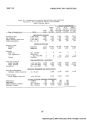
Show PART V REGIONAL NEEDS AND DEMANDS Projected Requirements Requirements for food and fiber, industrial commodities, and other goods and services are described under agricultural and industrial pro- jections. Agricultural projections Feed crop projections produced on irrigated and dry cropland and rangeland, including hay, field grains, and silage, have been modified-- and pasture, range, and native hay added--to utilize available resources to produce livestock and livestock products consistent with 1968 OBERS projections. Timber production reflects the region potential on a sus- tained yield basis but is not OBERS projections. A summary of projections for these commodities and other food crops is shown below. Agricultural commodities Units 1965 1980 2000 2020 Beef Mil. lbs. 207.3 282.1 375-6 492.9 Pork Mil. lbs. 2.0 1.5 2.0 2.6 Lamb and mutton Mil. lbs. 87.7 92.0 122.0 159.9 Wool Mil. lbs. 12.5 13.1 17.4 22.8 Milk Mil. lbs. 192.7 348.2 453.6 585.6 Farm chickens Mil. lbs. 0.5 0.9 1.1 1.4 Eggs Million 36.0 43.5 57.1 7^.3 Feed crops Hay 1,000 tons 1 ,168.1 1 .418.3 l .750.9 2,084.4 Feed grain 1,000 bu. 4 .417.0 7 .167.1 8 .350.3 9.281.9 Silage 1,000 tons 490.1 610.0 882.0 1,242.8 Pasture and range 1,000 AUM's 7 .737.0 8 ,681.2 10 .59^.6 11.7^5.5 Other crops Barley (Moravian) 1,000 bu. 750.0 1 ,549.0 2 ,646.0 3.760.0 Wheat 1,000 bu. 3 .576.0 5 ,258.0 5 .919.0 6,859.0 Orchard 1,000 tons 80.0 108.0 144.0 181.0 Sugar beets 1,000 tons 172.5 361.0 565.O 825.0 Dry beans 1,000 cwt. 765.0 835.0 929.0 1,026.0 Truck crops 1,000 cwt. 291.0 381.0 500.0 620.0 Potatoes 1,000 cwt. 397-8 463-8 552.0 64o.o Timber Mil. cu. ft. 53-0 170.4 285.8 34o.o Industrial projections The principal industrial activity projected is mining and processing of minerals and production of electric power. 48 |