| OCR Text |
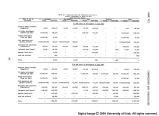
Show PART VII COMPARISONS AJSD CONCLUSIONS tvater development Associated development Federal Non-Federal Federal Non-Federal (thousands of dollars) 54,880 10,000 16,000 1->25O 62,420 3^,950 19,410 16,930 18,740 13,530 12,820 15,410 22,490 167,240 283,730 47,400 5,010 2,470 2,070 12,530 17,820 7,370 14,610 10,990 12,770 201,340 U4l,79O -34,490 1965-69 average annual installation OM&R Framework plan average annual installation I966-I98O 1981-2000 2001-2020 Increased annual OM&R (at end of period) 1966-1980 1981-2000 2001-2020 The large expenditures for the associated development program are primarily designated for the acquisition and development of recreational land and facilities and the installation and operation of thermal-electric generating plants. The 1965-69 figures represent the average in a period of declining Federal expenditures. Compared to the $64.9 million average, 1966 esti- mates showed $76.0 million and 1969, $47.6 million. Non-Federal expendi- tures remained at about the same level during the 1965-69 period. Conclusions The framework plan as outlined is general in nature and presents one way in which the region's water and related land resources can "be devel- oped and utilized to meet projected demands through the year 2020. Three states' alternative plans were formulated to reflect the capacity of the region to utilize resources and to supply goods and services not required under the framework plan. While the plan and the alternative levels of development were not studied in sufficient depth to identify alternative means of meeting needs and outline specific programs and projects, they satisfy the objectives of delineating the adequacy of the region's resources. The plans also iden- tify associated problems and considerations in relation to conserving the resources and to providing for the overall well-being of people. The framework plan generally meets all needs and demands of the re- gionally interpreted OBERS projections. The three "states' alternative" 101 |


