| OCR Text |
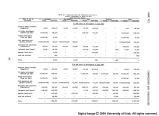
Show PART V REGIONAL NEEDS AND DEMANDS Table 5 - Water needs Regionally Interpreted OBERS level of develops Upper Colorado Region Type of use New On-site de ir) Green Upper San Juan- 5,900 55,700 3,700 6,800 - - 1980 - -7,800 50,400 10,300 22,200 4,300», 33,200 43,000 200,100 16,200 1,800 15,100 125,800 Electric power (therma 1) 34,100 26,700 19,500 38,800 72,500 Fish and wildlife 1,200 18,800 87,800 49,400 7,900 30,500 Recreation 100 600 100 1,000 200 2,000 800 600 600 Stockpond evaporation livestock use and 1,400 25,000 2,900 7.300 4,800 41,400 15,300 13,700 12,400 Subtotal 40,100 132,700 75,100 99,000 80,300 427,200 181,200 53,900 192,100 Irrigation; consumptiv use, incidental and e 1,479,000 719,000 245,000 117,500 588,000 190,000 334,000 65,000 2,653,000 1,091,500 591,000 120,500 Export 255,000 716,000 Less import (-)2,600 (-52.600 (-)2,6O0 Subtotal of all above 47,100 2,330,700 437,600 874,400 47 9,300 4,169,100 1 420,200 . 1,847,900 901,000 evaporation 660,000 67,000 17,000 576,000 Total for 1980 4,829,100 1 ,487,200 1,864,900 1,477,000 - - 2000 - - Municipal and industri al 4,800 34,300 10,600 12,100 5,900 67,700 16,900 24,900 25,900 Electric power (therma 1) 34,100 254,600 106,800 86,400 148,700 630,600 393,500 24,200 212,900 Minerals 300 19,900 3,900 10,300 22,100 56,500 32,000 16,700 7,800 Fish and wildlife 1,200 38,800 6,800 22,200 18,800 87,800 49,400 7,900 30,500 Recreation 300 1,000 100 1,600 200 3,200 1,300 900 1,000 livestock use 1,700 30,500 3,300 9,000 5,800 50,300 18,200 17,100 15,000 Subtotal Irrigation: consumptiv use, incidental and • 42,400 7,600 379,100 1,633,000 131,500 329,000 141,600 605,000 201,500 407,000 2,981,600 1 ,062,000 1,166,000 753,600 Export 883,000 117,500 437,000 150,000 1,587,500 587,000 880,000 120,500 Less import (-52,600 (-)2,600 (-52,600 Subtotal of all above 50,000 2,895,100 578,000 1,181,000 758,500 5,462,600 2 ,160,300 2,137,700 1,164,600 Main-stem reservoir 660,000 67,000 17,000 576,000 Total for 2000 6,122,600 2 ,227,300 2,154,700 1,740,600 - - 2020 - - Municipal and industri al 7,200 56,000 17,300 20,400 9,200 110,100 26,400 40,400 43,300 Electric power (therma 1) 30,100 254,600 106,800 86,400 148,700 626,600 393,500 24,200 208,900 Minerals 300 17,000 2,600 11,400 21,500 52,800 26,400 20,800 5,600 Fish and wildlife 1,200 38,800 6,800 22,200 18,800 87,800 49,400 7,900 30,500 Recreation 400 1,600 200 2,600 400 5,200 2,200 1,300 1,700 Stockpond evaporation livestock use and 1.800 35,800 4,000 10,700 6,700 59,000 21,200 20,600 17,200 Subtotal 41,000 403,800 137,700 153,700 205,300 941,500 519,100 115,200 307,200 Irrigation: consumptiv use, incidental and n 9,000 1,723,000 411,000 723,000 428,000 3,294,000 1 ,147,000 1,233,000 914,000 Export 883,000 117,500 467,000 185,000 1,652,500 652,000 880,000 120,500 Less import (-)2,600 (-)2,600 (-52,600 Subtotal of all above 50,000 3,009,800 666,200 1,341,100 818,300 5,885,400 2 ,318,100 2,228,200 1,339,100 Main-stem reservoir evaporation 660,000 67,000 17,000 576,000 Total for 2020 6,545,400 2 ,385,100 2,245,200 1,915,100 |


