| Title |
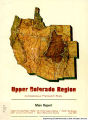
Upper Colorado Region Comprehensive Framework study : Main report. |
| Creator |
Upper Colorado Region State-Federal Inter-agency Group |
| Subject |
Water resources development; Watershed management; Flood control; Irrigation |
| Publisher |
Upper Colorado Region State-Federal Inter-agency Group : Pacific Southwest Inter-agency Committee, Water Resources Council [1971]Upper Colorado Region State-Federal Inter-agency Group : Upper Colorado Region State-Federal Inter-agency Group : Pacific Southwest Inter-agency Committee, Water Resources Council [1971] |
| Contributors |
Gessel, Clyde D.; Hagen, Robert H. |
| Date |
1971-06 |
| Type |
Text |
| Format |
application/pdf |
| Digitization Specifications |
Digital images were scanned by Backstage Library Works Inc. Bitonal materials were scanned at 400ppi using a Panasonic KV-S2065W sheetfed scanner. Grayscale materials were scanned at 400ppi using an Image Access WideTEK flatbed scanner. All files were saved as TIFF and converted to JPEG for Web presentation. PDF files were also generated from the TIFF files. |
| Language |
eng |
| Rights Management |
Digital image copyright 2004, University of Utah. All rights reserved. |
| Contributing Institution |
S.J. Quinney Law Library, University of Utah. 332 South 1400 East, Salt Lake City, UT 84112-0730 |
| Source Physical Dimensions |
26cm x 20cm |
| Scanning Technician |
Backstage Library Works 1180 S. 800 E. Orem, UT 84097 |
| Call Number |
KF5582.C6 A8 |
| ARK |
ark:/87278/s6q81cd3 |
| Setname |
wwdl_documents |
| ID |
1133059 |
| Reference URL |
https://collections.lib.utah.edu/ark:/87278/s6q81cd3 |