| OCR Text |
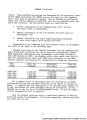
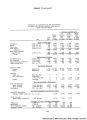
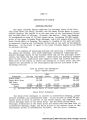
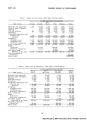
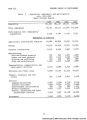
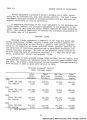
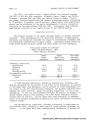
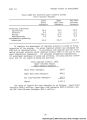
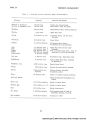
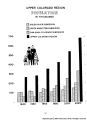
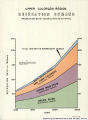
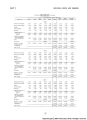
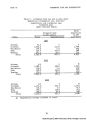
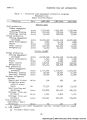
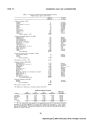
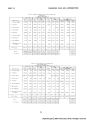
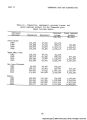
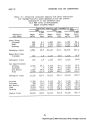
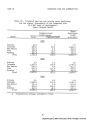
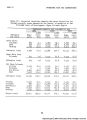
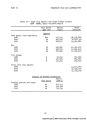
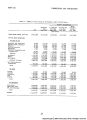
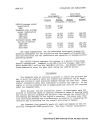
Show PARC VI FRAMEWORK PLAN AND ALTERNATIVES Table 9 - Staging of thermal-electric power generating plants, framework plan, Upper Colorado Region Capacity (megawatts) Location by state Plants in service in 1965 Durango 5 Animas 31 Four Corners 1, 2, and 3 633 Oliver 3 Cameo 75 Bullock 10 Nucla 38 Rock Springs 25 Naughton Wo. 1 163 Carbon 189 Hayden No. 1 163 Total in service - 1965 1,335 Actual and proposed additions to 198oi/ Naughton Wo. 2 220 Naughton Wo. 3 330 Four Corners No. 1+ 795 Four Corners No. 5 795 San Juan Wo. 1 and No. 2 660 Navajo Nos. 1, 2, and 3 2,310 Kaiparowits 2,1+00 Four Corners Wo. 6 800 Jim Bridger Wos. 1, 2, and 3 1,500 Emery County Wo. 1 330 Emery County No. 2 1+1*0 Hayden No. 2 500 Craig 1,000 Total additions 12,080 Actual and probable plant retirement to I98O Rock Springs (actual) 25 Oliver 3 Durango _____5 Total retirements 33 Net plants in service - 1980 13,382 Proposed additions 198l-2OOOl/ Blacksfork No. 1 1,200 Four Corners Wo. 7 and Wo. 8 1,600 San Juan No. 3 3^0 Kaiparowits 2,1+00 EX Paso 1,500 Jim Bridger No. 1+ 500 Hayden No. 3 1,000 Milner 1,000 Northwest Colorado (not necessarily one plant) 11,700 Upper Green No. 1 2,000 Upper Green No. 2 2,000 Sweetwater 2,000 West Central Colorado 1,500 Total proposed additions 28,71+0 Probable retirements 1981-2000 Bullock 10 Animas ____31 Total retirements 5T Net plants in service - 2000 1+2,081 (No additions or deletions of installed capacity 2001-2020) Colorado New Mexico New Mexico Colorado Colorado Colorado Colorado Wyoming Wyoming Utah Colorado Wyoming Wyoming New Mexico New Mexico Wew Mexico Arizona Utah New Mexico Wyoming Utah Utah Colorado Colorado Wyoming Colorado Colorado Wyoming New Mexico New Mexico Utah Wew Mexico Wyoming Colorado Colorado Colorado Wyoming Wyoming Wyoming Colorado Colorado New Mexico Steamplant capacity in service State 1965 (megawatts) 1980 (megawatts) 2000 (megawatts) 2020 (megawatts) Depletions (acre-feet) year 2000 Colorado New Mexico Wyoming Utah Arizona 29I+ 661+ 188 189 0 1,786 3,711+ 2,213 3,359 2,310 16,976 7,123 9,913 5,759 2,310 16,976 7,123 9,913 5,759 2,310 25!+, 600 106,800 ll+8,7OO 86,1+00 31+, 100 Total 1,335 13,382 1+2,081 1+2,081 630,600 3./ The construction time sequence of the powerplants should not be construed as reflecting agreement by the power companies or the states as to priority of construction. Also, in addi- tion -to those listed as retired, other capacity will reach normal retirement age (30-35 years) during the study period. Retirement will depend on the then existing condition and the need for peaking and reserve capacity. |