| OCR Text |
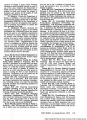
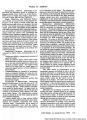
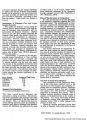
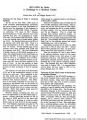
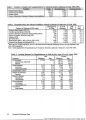
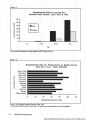
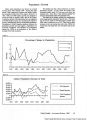
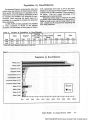
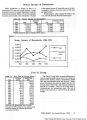
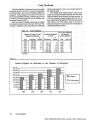
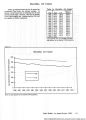
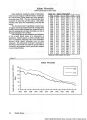
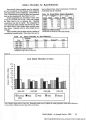
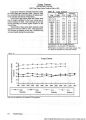
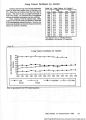
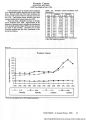
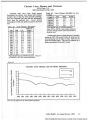
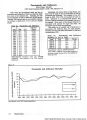
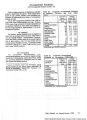
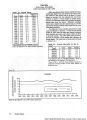
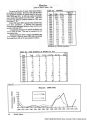
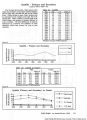
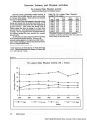
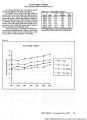
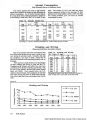
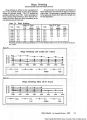
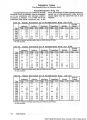
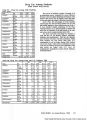
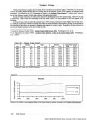
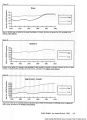
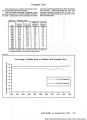
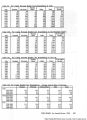
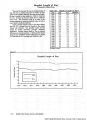
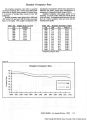
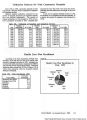
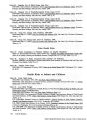
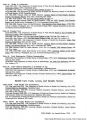
Show Population Growth Utah's total population has shown an overall increase from 1951 through 1994. During this time period, Utah experienced a growth rate nearly double and sometimes triple that of the nation. However, in 1987, 1988, and 1989 Utah's growth rate dropped to nearly the same or slightly below that of the nation. Around this period, Utah experienced net-out migration of 59,000 people because of a declining job market in mining, manufacturing and the construction industries. Fluctuations in Utah's migration patterns influence the population growth rate and suggest a dependence on economic conditions. The rebound in in-migration during the 1990s is an indication of the relative strength of the Utah economy. The fertility rate has a direct influence on Utah's population growth. In the 1970s the fertility rate increased steadily until 1979 and was well above the national rates. Since then, it has declined steadily but remains substantially higher than national rates. The death rate is another variable for consideration when analyzing the population growth rate. The death rate of 6.6 for Utah in 1970 decreased steadily until 1984 when it reached a low of 5.3. There was a slight increase in this rate during the mid to late 1980s, but overall, the Utah death rate was well below that of the nation. Figure 1 Percentage Change in Population I ' I ' I ' I ' I I ' I ' I I ¦ I ' I ¦ 1 ' I ¦ 1 ' I ¦ 1 0 1951 1955 1959 1963 1967 1971 1975 1979 1983 1987 1991 Figure 2 Annual Population Increase in Utah 60,000 j 50,000--40,000 - -30,000--20,000--, 10,000 + 0 -10,000---20,0001 1951 1957 1963 1969 1975 1981 1987 1993 ¦ ¦ \ /' \ V w ; • >\f i' i »t t»% gj' i i i i n i f i -------------Net Migration --------------Natural Increase Total Population Increase Utah's Health: An Annual Review 1995 43 |