| OCR Text |
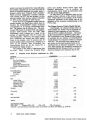
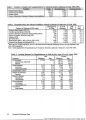
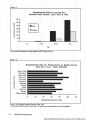
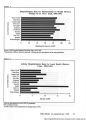
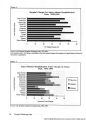
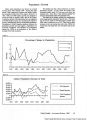
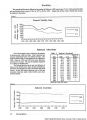
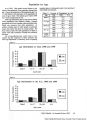
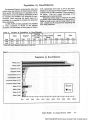
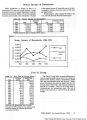
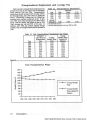
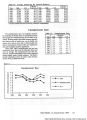
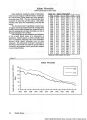
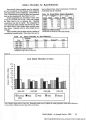
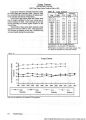
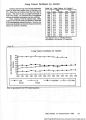
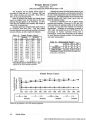
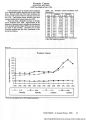
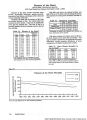
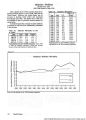
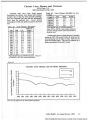
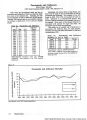
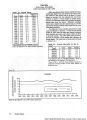
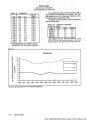
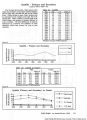
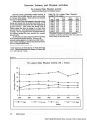
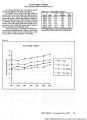
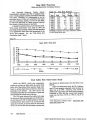
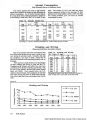
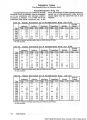
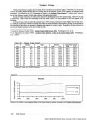
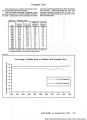
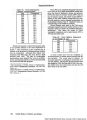
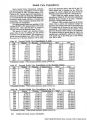
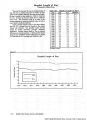
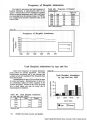
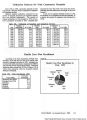
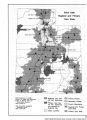
Show 37) shows the rates of one of those conditions (asthma) by local health district. Tracking Expenditures for Health Conditions The health care resources expended for care of a condition can be persuasive information for communicating the importance of that condition to legislators and other public policy makers. For example, knowing that more than 19,000 hospitalizations of Utah residents occurred for injuries during 1992-1993 may not be as persuasive for some audiences as knowing that those hospitalizations resulted in over 168 million dollars being billed to patients or insurance companies (see Figure 6, page 38). These data may be made more useful if the proportion of those charges billed to public sector payers such as Medicare or Medicaid is known (see Figure 7, page 38). Several limitations must be considered, however. First, most hospital discharge data contain the amount charged to the patient or to a third party payer, not the amount actually paid or the actual cost to the hospital (Finkler, 1982). Second, while hospital expenditures account for a large proportion of total health care expenditures, that proportion may vary for different conditions and may change over time for one condition if treatment practices change. Methodologic Issues Defining the Population The population served by an individual hospital usually cannot be exactly defined. At least two approaches have been used to define geographic areas for population-based analyses of hospital discharge rates. One approach is to use existing geographic boundaries, e.g. counties, or health administration areas, such as Utah's multi-county health districts. These boundaries often correspond to existing health policy organizations, such as health departments. However, they may not correspond well to the organization of the medical care system. A second approach, defining hospital service areas, is used when correspondence to the medical care system is desired. While other methods of defining hospital service areas have been used, the most common has been to aggregate contiguous zip code4 areas together into a service area containing one or more hospitals. Discharges of residents of a zip code and the population of that zip code are assigned to the area where a plurality of residents of that zip code are hospitalized. The theory behind the hospital service area is that the medical practice systems located in a geographic area influence utilization by persons residing in that area even if they leave that area for care. Factors that influence the choice of a geographic level include the following: (1) an adequate number of disease occurrences for analyses; (2) the population estimates and other area characteristics for which data are available; and (3) the extent to which those areas define populations that are homogeneous demographically, and with regard to the health care delivery system. Data to describe the population and the health care system may be more readily available for areas defined by existing geographic boundaries. Hospital service areas may be more useful, and they have been more extensively used, outside of highly urbanized areas. Statistical Methods Rates should be calculated based on hospi-talization of persons who are members of the population being studied. For example, if a county rate is calculated, all hospitalizations of residents of that county should be included, whether they are hospitalized inside or outside of that county. Hospitalizations of non-residents should not be included because they are not part of the denominator of the rate, the population of that county. Rates should generally be age-adjusted; either direct or indirect adjustment may be appropriate depending on the circumstances and planned uses of the results (Paul-Shaheen, Clark & Williams, 1987; Kahn & Sempos, 1989; Carriere & Roos, 1994). Appropriate statistical methods should be used to assure that areas are not labeled as having high rates merely because of random variation attributable to small numbers (Diehr, Cain, Ye & Abdul-Salam, 1993; Schwartz, Ash, Anderson et al., 1994; Diehr, Cain & Connell, 1990). A reasonably simple approach is to calculate a confidence limit for the adjusted rate for an area (Kahn & Sempos, 1989) and compare that with an average rate for all areas being examined. Classification Systems for Diagnoses and Procedures Hospitalizations are coded using two different but related classification systems: the International Classification of Diseases (ICD-9) and Diagnostic Related Groups (DRG). Either may be appropriate for use depending on circumstances, but use of the ICD-9 system will facilitate comparisons with other data sources, such as death certificates. In addition, the NHDS, which provides national data for comparison, uses ICD-9 coding. In general, individual ICD-9 codes (over 10,000) are too specific for practical use and should be grouped to be more meaningful (Graves, 1994; Agency for Health Care Policy Research, 1994). The method by which codes are grouped is currently not adequately developed or standardized. Utah's Health: An Annual Review 1995 29 |