| OCR Text |
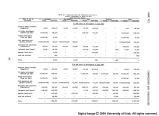
Show PART VI FRAMEWORK PLAN AND ALTERNATIVES Table 8 - Projected watershed management programs Framework plan Upper Colorado Region Practice Unit 1966-1980 1981-2000 2001-2020 Federal Land Erosion, sediment, and runoff control Land treatment Brush and weed control Acres 929,014 1,265,800 393.017 Watershed tillage Acres 116,300 174,200 79.720 Seeding Acres 360,768 501,600 247,900 Stabilization Acres 12,657 12,657 2,367 Gully control Miles 1.966 1.976 422 Sheet erosion control Acres 150,300 151.300 31.000 Water control Detention dams No. 184 307 214 Check and drop structures No. 14,629 24,091 12,773 Diversion dams No. 100 230 277 Dikes No. 83 156 228 Streambank- lake shore stabilization Miles 533 109 Debris basins No. 18 17 3 Water yield improvement Type conversion Acres 376,710 379.^10 75.^2 Private Land!/ Erosion, sediment, and runoff control Land treatment Watershed tillage Acres 79,228 103,440 90.245 Tree and shrub planting Acres 1,066 965 713 Stabilization Acres 78,935 6l,122 40,366 Water control Detention dams No. 561 564 298 Check and drop structures No. 7.611 5.189 2,881 Diversion dams No. 1.134 1,448 804 Water spreading Acres 139.710 149,198 9^.777 Grade stabilization structures No. 311 622 31L Floodway Feet 10,650 21,400 10,650 Debris and sediment basins No. 815 1,630 815 ~TJ Includes Indian land. 67 |


