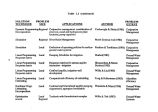
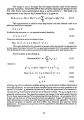
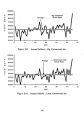
OCR Text |
Show presented in Tables 4.1 and 4.2. Table 4.1 shows an average increase of 70% in the total pumping rate for the constraints specified. The increase is not uniformly distributed across the demand districts. Granger and South Salt Lake can potentially triple their usage. Table 4.1 Optimal versus Actual 1982 pumpage by Area ( Max Permissible drawdown 15') Water District 1982 Pumpage Optimal Pumpage ( 1000 ac* f! vear ( 1000 ac- ft/ vr) *%> Increase 1 - SL County 8.83 16.37 85 2 - Murray 4.90 9.55 95 3 - SL City 12.09 17.21 42 4 - S Salt Lake 2.15 6.27 192 5 - Holladay 1.10 1.56 41 6 - Riverton 2.49 4.22 70 7 - Granger 1.85 5.39 192 8 - White City 1.72 2.59 51 9 - Sandy City 8.16 10.77 32 10- Magna MS 1.31 49 Total 44. J7 1525 2Q On the other hand only modest increases of 26% and 32% for White City and Sandy City can be achieved. This is consistent with the results in the previous chapter, where cost factors were explicitly considered. Here, even though costs are not explicitly considered, the constraint on permissible drawdown essentially dictates a similar solution. The reader is reminded that the water quality and the water rights constraints were in force in both sets of applications. An annual yield of 75,250 acre- feet can thus be developed even under limits on drawdown, maximum pumping rate at each node, water quality and water rights maintenance. Table 4.2 illustrates that by and large pumping was increased at all wells from their current levels. The upper bounds restricting the increase in pumpage were indeed active for most well locations. However, the wells located in the Sandy/ White City area pump at rates close to their 1982 values. This is a consequence of the drawdown and the water rights constraints specified. It also indicates that this area of the aquifer is more fully developed than the rest. A total of 15 out of 181 of the head variables were affected by the water rights constraints. This conclusion was prompted by an examination of the dual values associated with the water rights constraints and the head variables at the associated nodes. None of the water quality constraints were dominant in the solution. Combinations of well pumping at adjacent nodes were obtained that allowed an increase in the individual pumping rates while maintaining the permissible head gradient out ofAinto the contaminated area. Parametric analyses: Three sets of parametric runs of the model were performed ( 1) variable Permissible drawdown, ( 2) variable upper limit on well pumpage, and ( 3) variable lower limit on the water district demands. The results from these are briefly discussed below. 98 |