| OCR Text |
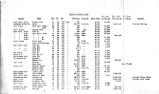
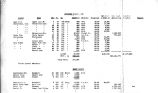
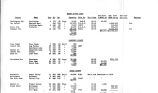
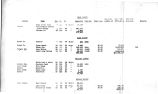
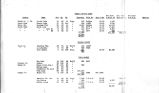
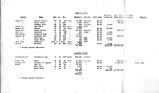
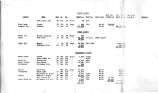
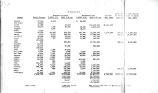
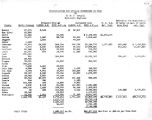
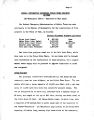
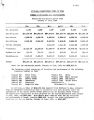
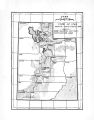
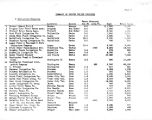
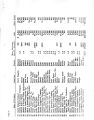
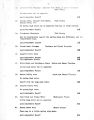
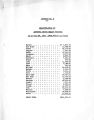
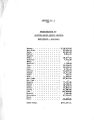
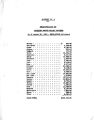
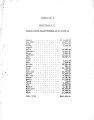
Show APPENDIX N0 « 1 Rich County 25$ Box Elder County £ 0$ Cache County * iD^ Cache Co- onty 20$ Cache County 25$ UTAH STATE AGRICULTURAL EXPERIMENT STATION LOQAN, UTAH ESTIMATED RUNOFF UTAH WATERSHEDS - 1924 The following briefly summarizes the probable water supply that will be available on the different watersheds of the State during 19340 Figures show per cent of normal0 10 Bear River Area above Beer Lake 2o Bear Lake Drainage 3o Cub River Drainage 4c Mtplfl Creek, High Creek, Summit Creek, Providence Creek, etc* 5c Logan ^ iver Drainage April- September Runoff Minimum 36,000 A. F « Maximum 40,000 A, Fo July- September Runoff • 15,000 A. F* M 19,000 A* F « Maximum discharge 270 cfa9 6o Blacksmith Fork River Drainage Cache County 30$ April- September Runoff Minimum 16,000 A. F° Maximum 20,000 A<> Fa July- September Runoff " 69000 A* Fo ' « 6,, 700 A8 ye 7c Little Bear River Drainage Cache County 28$ April- September Runoff July- September Runoff 8o Ogden River Area South Fork at Huntrville Weber county 25$ April- September Runoff 13,000 Aa Fo July- September Runoff 4,000 A. Fo 9* Weber River Area Weber River at Oakley Summit County 25$ Little high water can be oxpectedo April- September Runoff Minimum 55,000 Ac F0 Maximum 59,000 k* F « July- September Runoff • 8,50G A. F„ » 8,600 K Fo 10o Salt Lake City Watersheds Salt Lake County April- September Runoff 35$ July- September Runoff 38$ 11 o Provo Watershed Provo River at Provo Utah County 30$ No high water can be expected^ April- September Runoff Minimum 52,000 A, F. Maximum 56,000 Ac Fo July- September Runoff " 20,000 Ao F. • 22,300 Ae F » |